Deforestation
How do we track, understand, and prevent deforestation?
The Atlantic Forest has experienced major deforestation over the centuries.
Early native populations had already altered the original forest by slash-and-burn agriculture for thousands of years. However, it was the arrival of Portuguese colonizers in 1500 that devastated the landscape. The large-scale colonial sugarcane and coffee plantations consumed vast forest areas, not only for farmland but also to fuel mill furnaces with timber and charcoal. The introduction of cattle and exotic African grasses converted exhausted agricultural lands into extensive pastures. Meanwhile, rapid urbanization and industrialization created a massive demand for charcoal as an energy source. (Marques & Grelle, 2021)
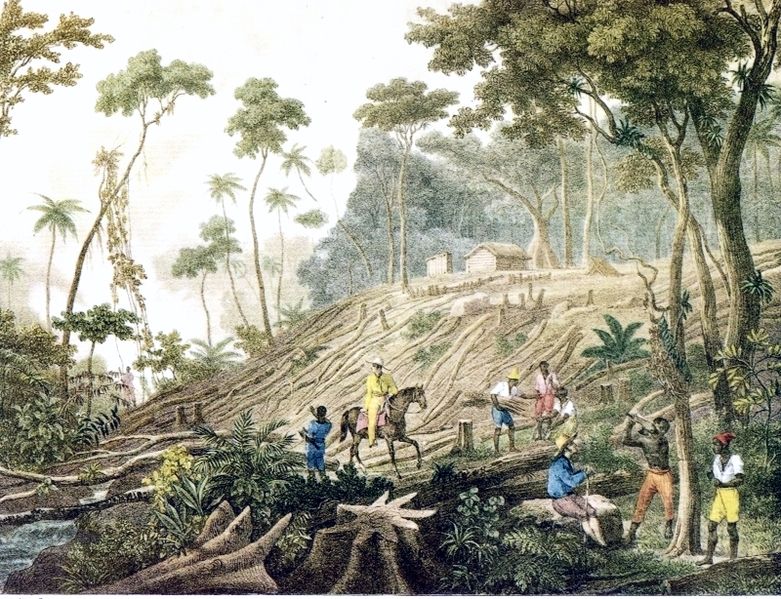
Slaves clearing the Atlantic Forest in Brazil. "Défrichement d'une Forêt" (Clearing of a Forest), Johann Moritz Rugendas, c. 1820-1825. Public domain, via Wikimedia Commons.

By the late 20th century, less than 10% of the original Atlantic Forest remained.
Starting in the 1980s, counter-movements for nature conservation gained momentum in Brazil. Citizens, scientists, organizations, and governmental bodies alike began creating frameworks to protect the Atlantic Forest—one of the world's most critical biodiversity hotspots. In 2006, Brazil enacted the Atlantic Forest Law (Law No. 11.428), which prohibits deforestation of primary forest and strictly regulates cutting of secondary vegetation, permitting exceptions only for public utility, scientific research, or traditional activities (Brasil, 2006). However, enforcing such protections across over a million square kilometers of fragmented forest—much of it on private land—remains a formidable challenge.
Illegal logging, land-use change, and invasive species continue to threaten what remains of the Atlantic Forest. In one Nature study, researchers detected losses of about 180,000 ha between 2010 and 2020. The losses were likely illegal and occurred both on small patches of private lands for agricultural expansion and in protected areas and Indigenous lands.
With the advent of remote sensing and geospatial technologies, large-scale planetary monitoring has become a reality.
These tools now make it possible to observe the Atlantic Forest at unprecedented scales, track deforestation patterns over time, and design more effective intervention and conservation strategies.
In this article, we explore how remote sensing is being used to monitor and protect what remains of this biome.
Remote Sensing of the Atlantic Forest
Remote sensing is literally sensing (acquiring information about the Earth's surface) remotely (i.e., from a distance).
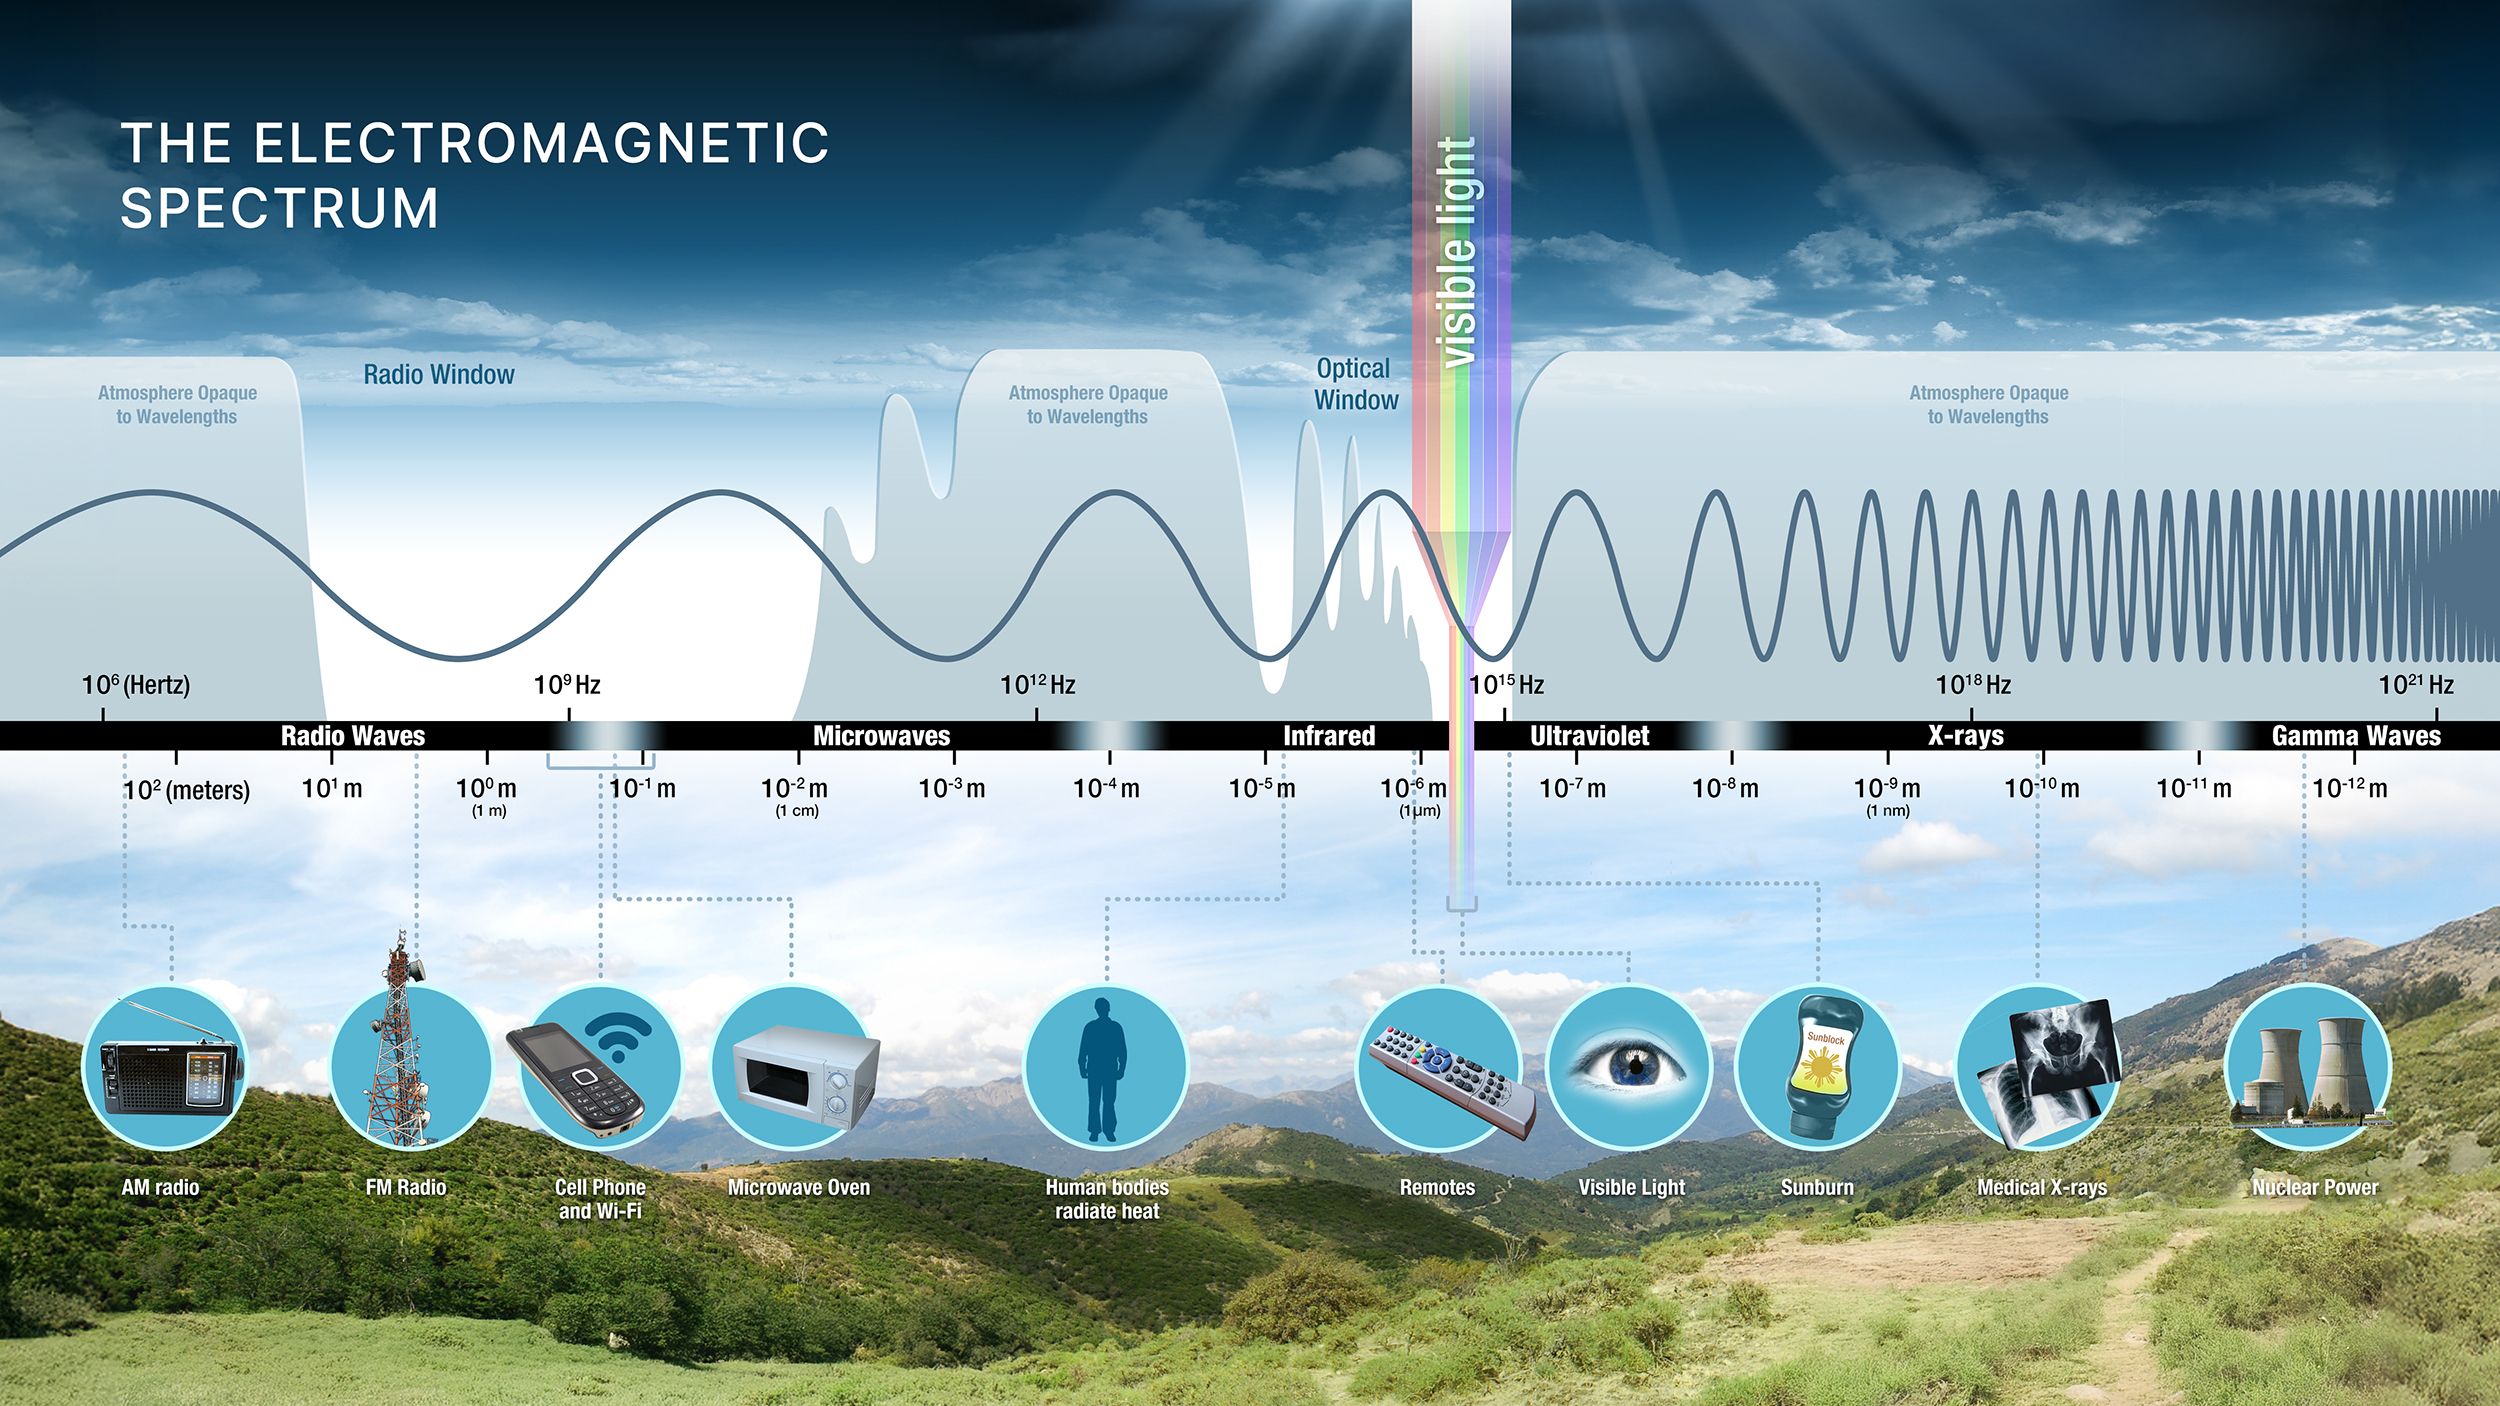
The Electromagnetic Spectrum. Credit: NASA Earthdata
Typically, we use instruments aboard satellites or aircraft that detect and record reflected or emitted electromagnetic energy. Electromagnetic energy travels as waves through the atmosphere and space, and is produced by the vibration of charged particles. These waves, known as electromagnetic waves, exist on an entire spectrum - from longer waves (like radio waves) to very short waves (like x-rays).
Most remote sensing instruments depend on the Sun to illuminate the Earth, then measure the energy reflected to the instrument. While humans can only detect visible light (a small range of electromagnetic waves), satellite sensors capture reflectance across the entire electromagnetic spectrum.
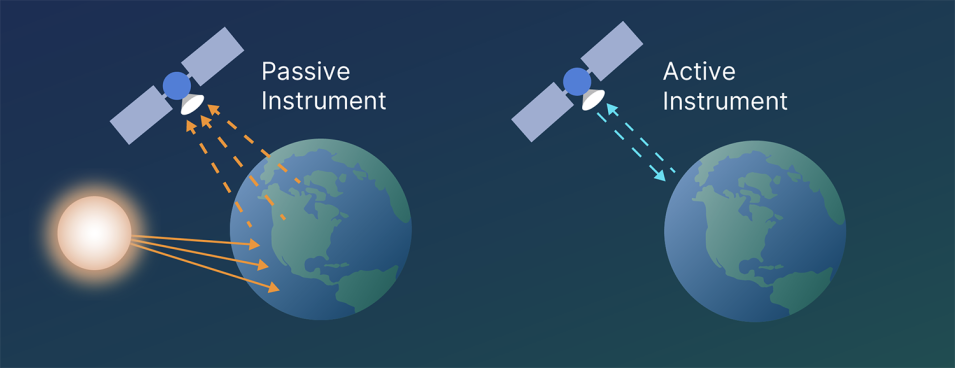
Remote sensing instruments are typically passive, measuring the Sun's reflected light rays. Credit: NASA Earthdata.
Different materials on Earth's surface — vegetation, water, soil, pavement — each have unique "spectral signatures," reflecting and absorbing light differently at various wavelengths.
For instance, healthy leaves contain chlorophyll that absorbs red and blue light for photosynthesis but reflects green light, which is why we see plants as green. As a plant wilts or is replaced by pasture, for example, the proportions of reflected energy at different wavelengths change.
This is the basis for remote forest monitoring.
Importantly for remote sensing, healthy vegetation strongly reflects near-infrared (NIR) light, since this energy would otherwise overheat the plant.
This creates a distinctive spectral pattern that satellites can detect. Specifically, the Normalized Difference Vegetation Index (NDVI) is one of the most widely used metrics for measuring vegetation greenness. It exploits the fact that healthy vegetation reflects near-infrared (NIR) light strongly while absorbing red light.
$$ \text{NDVI} = \frac{\text{NIR} - \text{Red}}{\text{NIR} + \text{Red}} $$
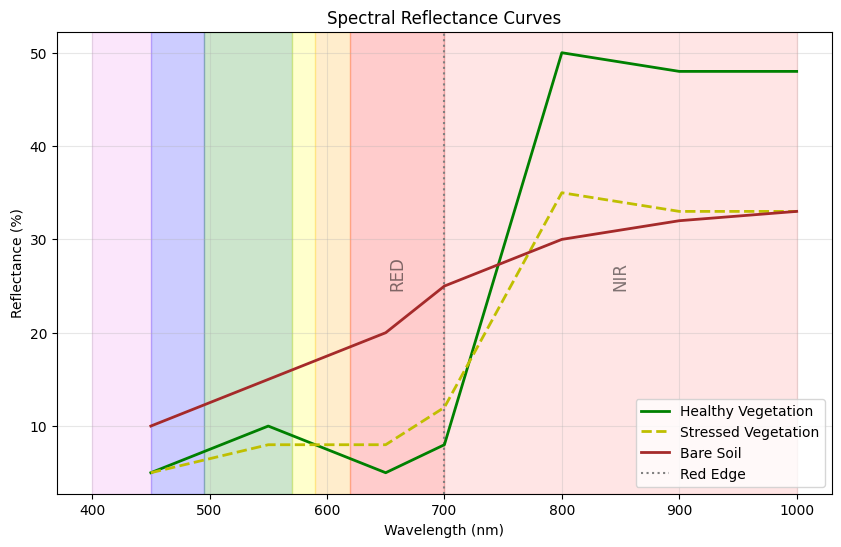
Idealized reflectance patterns for soil, stressed vegetation, and healthy vegetation (not real-world values). Note the drop and subsequent jump in the RED and NIR bands respectively for healthy vegetation.
NDVI values range from -1 to +1, where values close to +1 indicate dense, healthy vegetation and values near 0 or negative indicate bare soil, water, or urban areas.
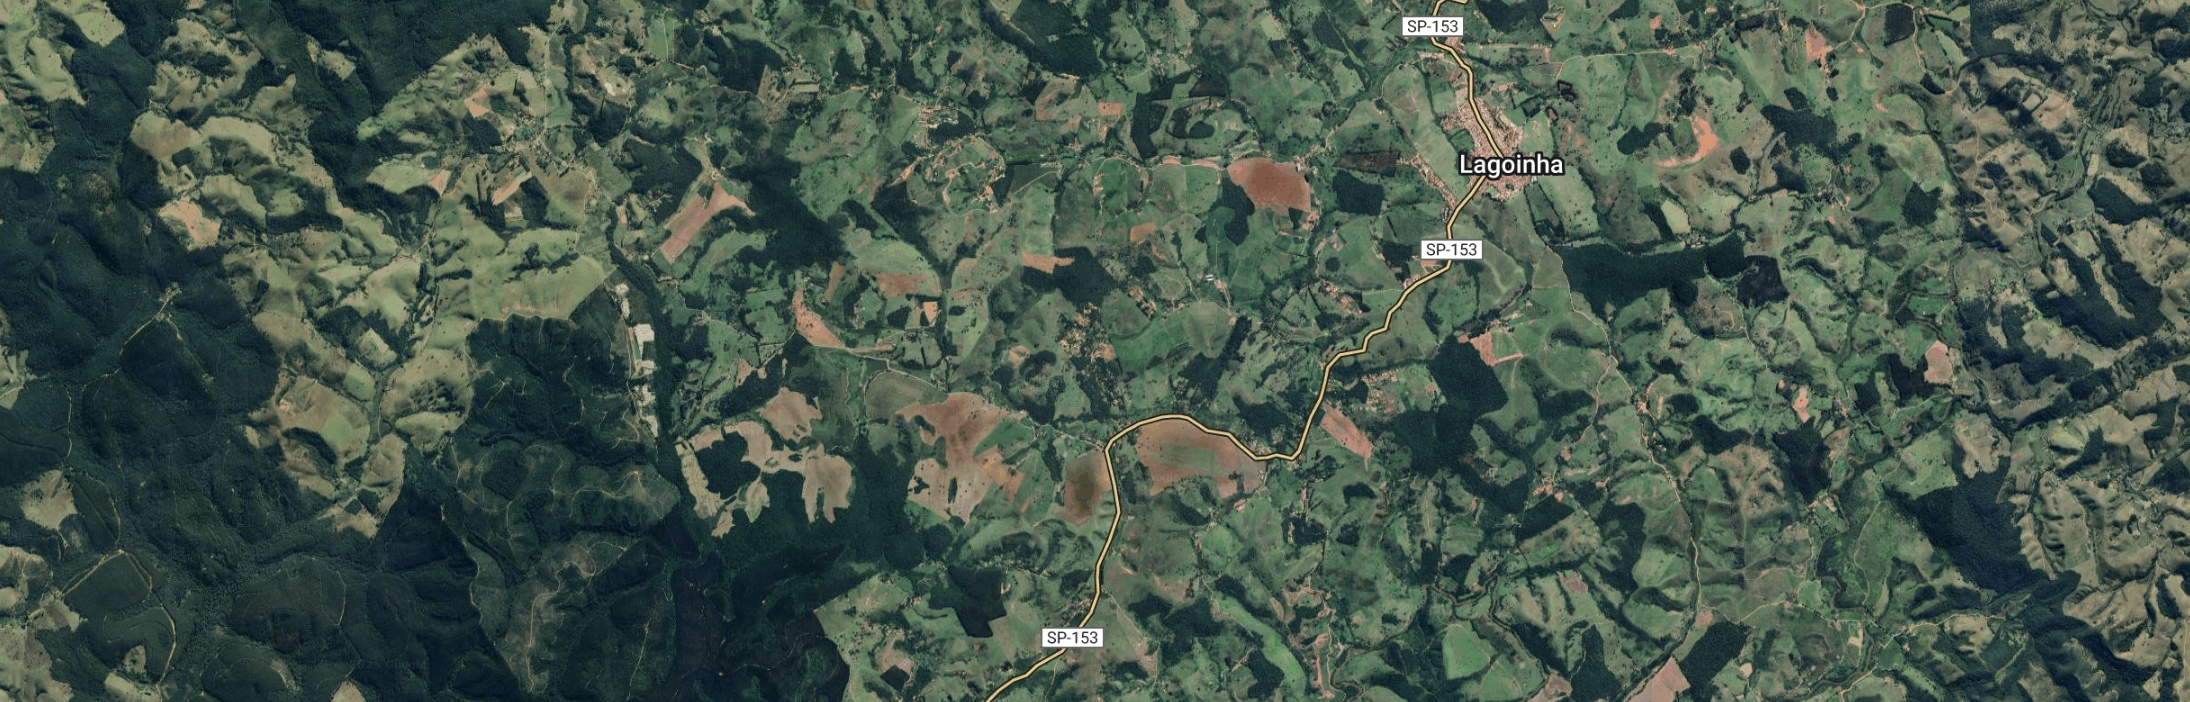
Satellite image of the Atlantic Forest in São Paulo state. | NDVI image visualized where darker green pixels indicate values closer to 1 (more lush vegetation), and white pixels indicate values closer to 0 (more urban areas).
We can track NDVI to see how vegetation changes over time. For instance, the image below shows a forest patch in the Atlantic Forest being converted into agriculture in 2019. Instead of steadily high values around 1 (indicating a lush forest), we see more seasonal variations as crops are grown and then harvested.
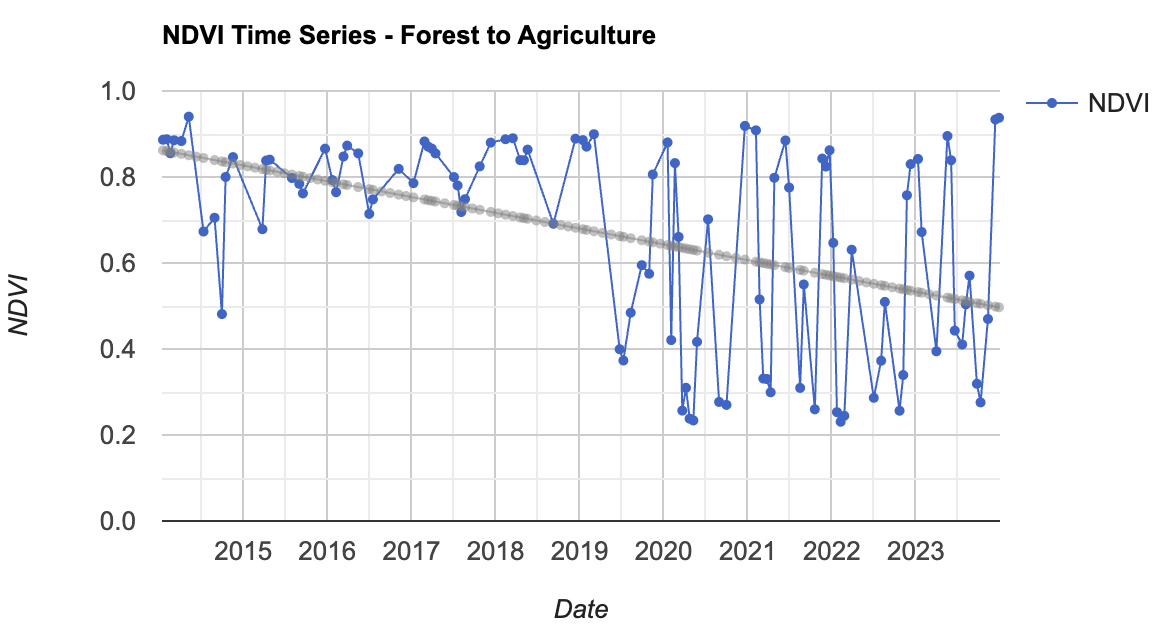
NDVI derived from Landsat 8 over time of a patch of Atlantic Forest turning into Agriculture in 2019.
The image above also exposes NDVI's limitations. Although NDVI allows us to detect vegetation presence and health, crops and pastures can also show high NDVI values, potentially masking forest loss. Therefore, scientists sometimes use more involved spectral indices, such as the Normalized Difference Fraction Index (NDFI).
There are also more sophisticated tools for temporal analysis.
One example is the CCDC (Continuous Change Detection and Classification) algorithm, developed by Zhe Zhu and Curtis Woodcock in 2014, and it works in three steps:
- Fitting harmonic (seasonal) models to time series of satellite observations
- Detecting breakpoints when observations deviate significantly from the predictions of the model
- Classifying the land cover before and after each break
CCDC is particularly useful for analyzing seasonal patterns and their disruptions, enabling scientists to detect forest degradation, deforestation, and regrowth.
In the above example, we can compute the breakpoints using the CCDC algorithm (or use precomputed values). For the above example, for instance, we get a breakpoint in 2019.
Geospatial Embeddings
In 2025, Google DeepMind released the AlphaEarth Foundations model. This geospatial model can combine many types of Earth observations into a new, unified coordinate system valuable for global mapping and monitoring.
The resulting satellite embeddings are coordinates composed of 64 numbers that represent combinations of thousands of input bands. The embeddings are constructed so that two locations on Earth have similar numbers if they share characteristics. This means, for instance, that solar panels across the world may still have very similar embeddings, even though they are geographically very far apart.
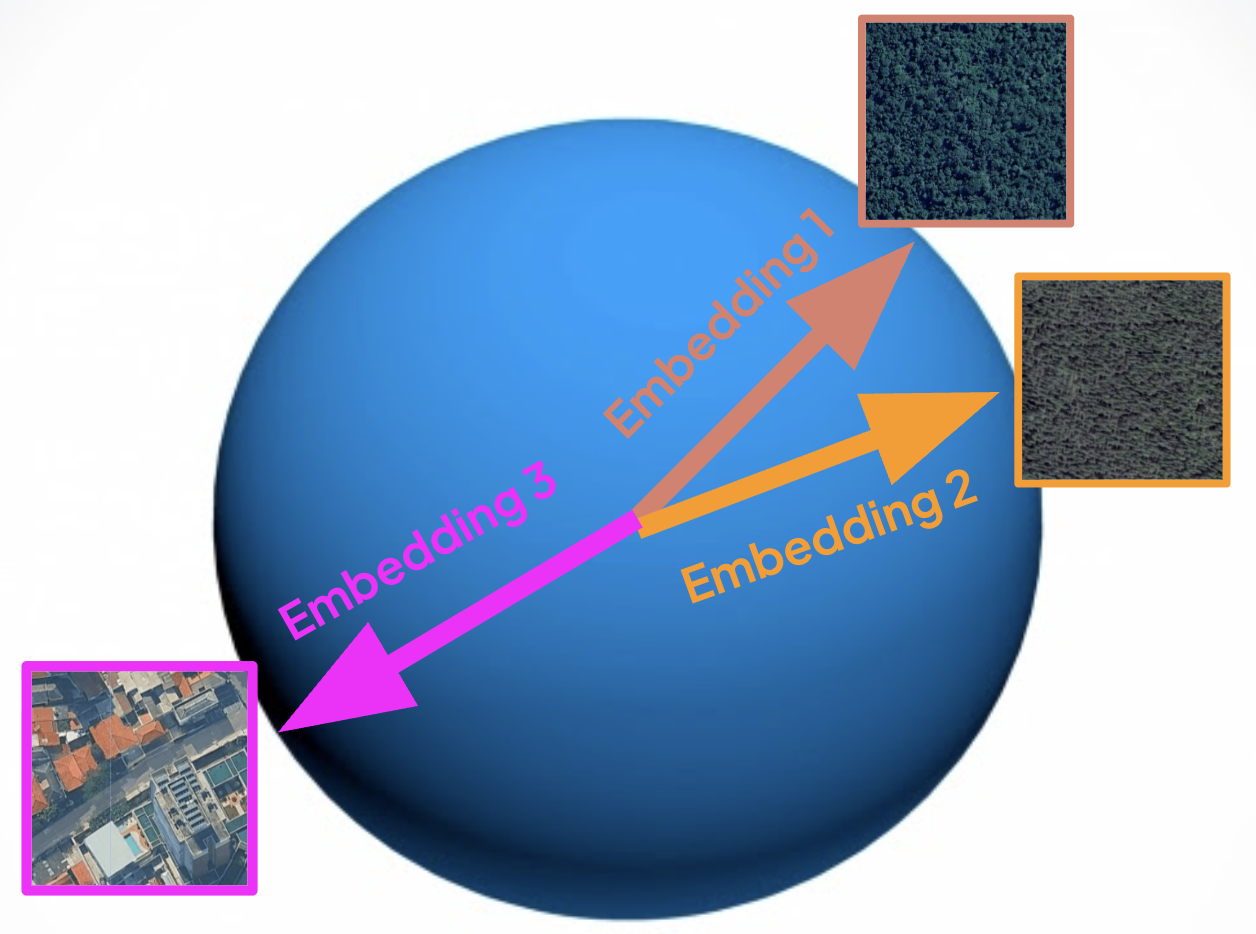
Using the Satellite Embeddings derived from AlphaEarth Foundations, similar areas have coordinates that are closer together, even though great geographic distances may separate them.
This approach to producing coordinates also means that the embedding of the same location can change over time as its composition changes. For instance, by comparing how much embeddings have drifted between two points, we can find regions with significant changes.
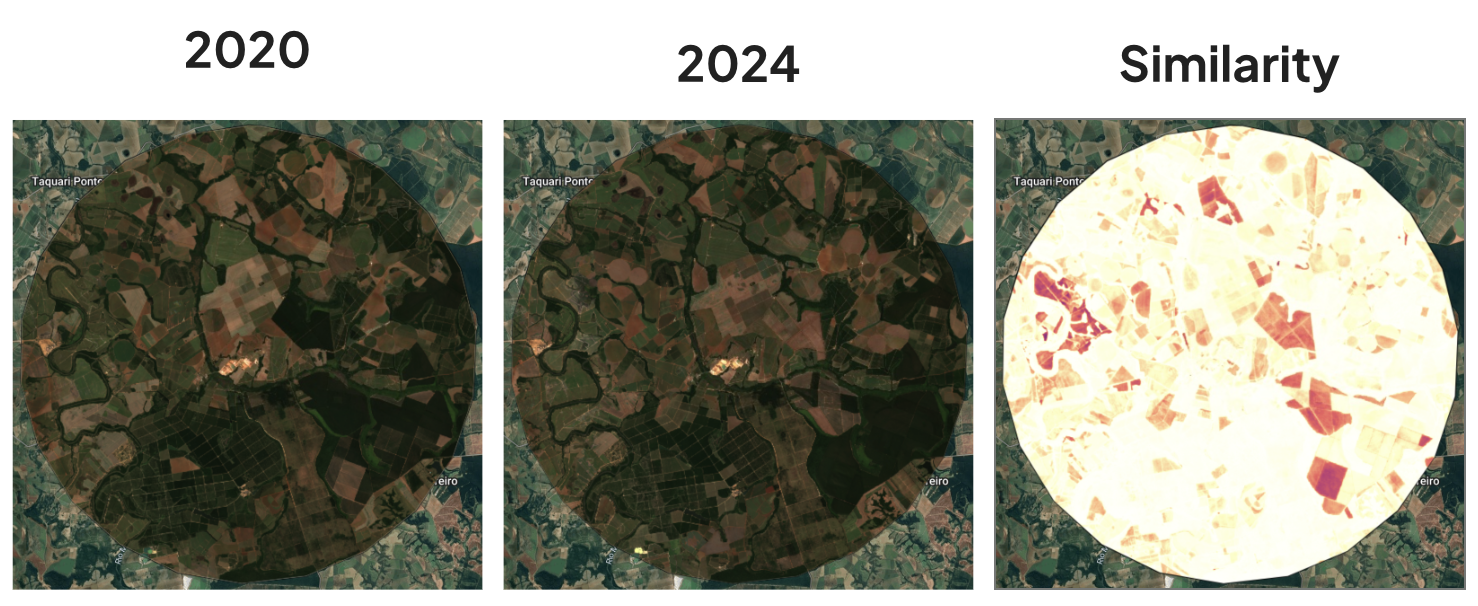
Similarity between the Satellite Embeddings in 2020 and 2024 of a region in the Atlantic Forest outside of São Paulo. Darker spots indicate regions of greater change, which can reflect both forest loss and gain.
The embeddings have also proven very useful for other tasks, such as classifying areas into distinct land cover and land use categories.
Deforestation Platforms
Due to its utility, there have been many efforts to use remote sensing to track and characterize deforestation. Some of these initiatives include
-
MapBiomas Deforestation Platform: MapBiomas is a network of universities, NGOs, and technology companies active in 14 countries across South America and Indonesia. It provides an open platform of data, maps, and tools to make knowledge about land cover and land use accessible. They have specific modules for deforestation,
-
Global Forest Watch: A platform from the World Resources Institute (WRI) providing data and tools for monitoring and protecting the world’s forests. The website allows users to access everything from real-time deforestation alerts to historical trend analysis.
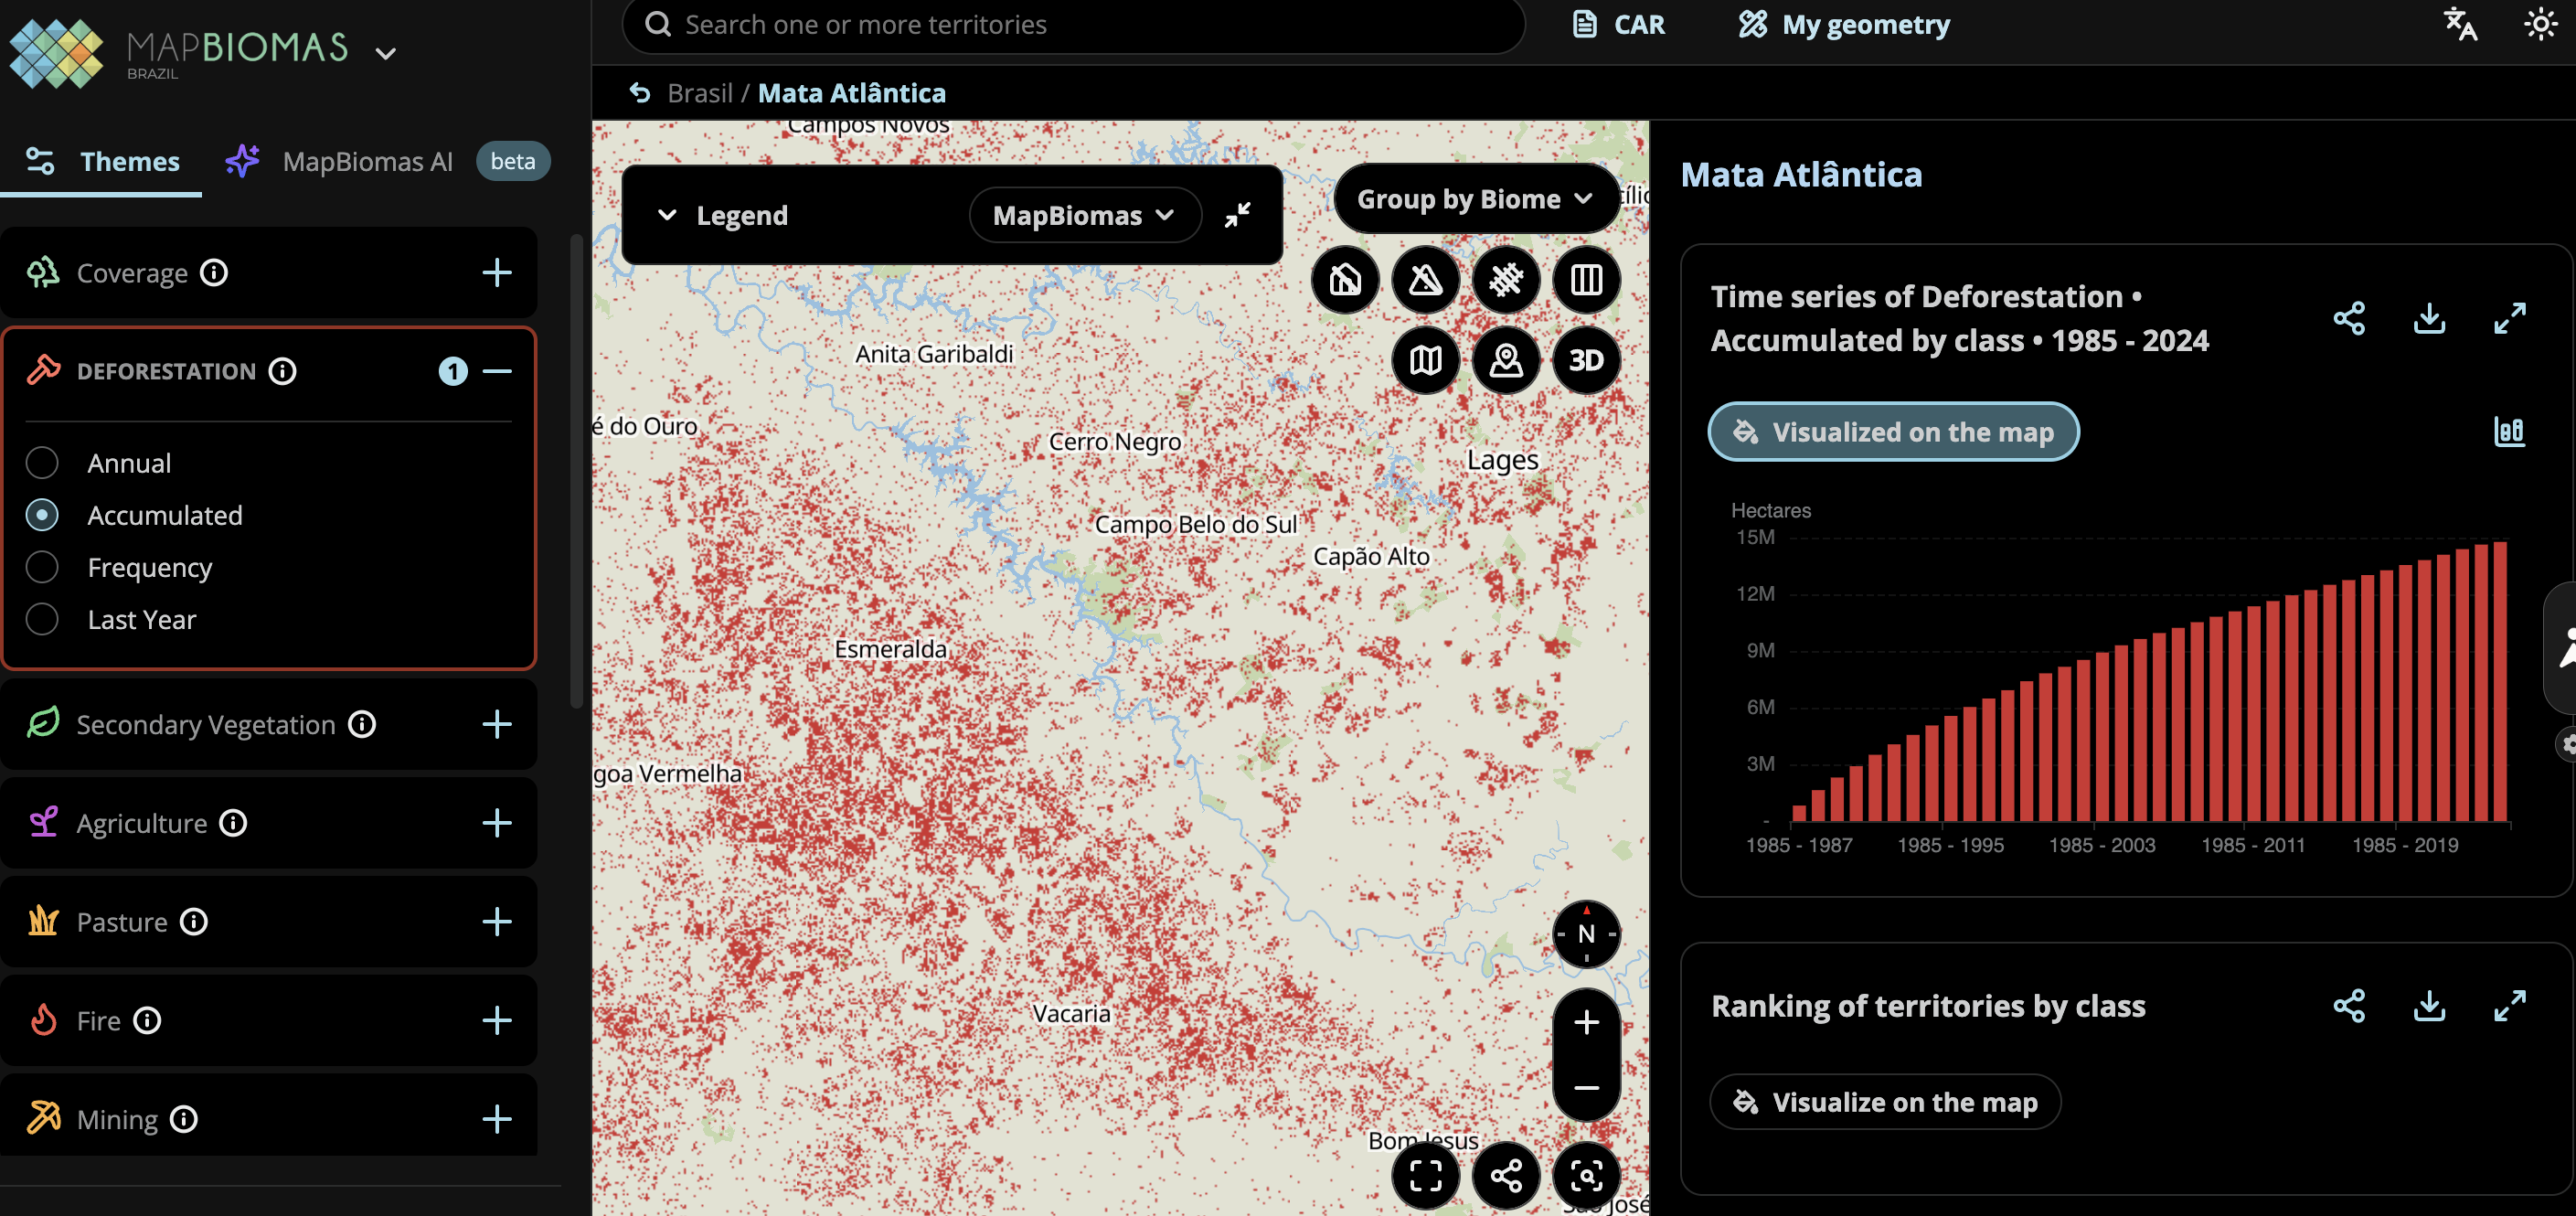
MapBiomas deforestation platform over a region in the Brazilian Atlantic Forest.
-
Hansen Global Forest Change dataset: Provides a global, 30 m resolution map of forest cover and change over time based on Landsat imagery (from 2000 up to 2024). This dataset is widely used to map and quantify deforestation, reforestation, and forest dynamics over time.
-
Drivers of Forest Loss: A dataset produced by the World Resources Institute (WRI) and Google DeepMind of the dominant driver of tree cover loss from 2001-2024 globally at 1 km resolution. The dominant driver is classified into one of seven driver categories: permanent agriculture, hard commodities, shifting cultivation, logging, wildfires, settlements and infrastructure, and other natural disturbances.
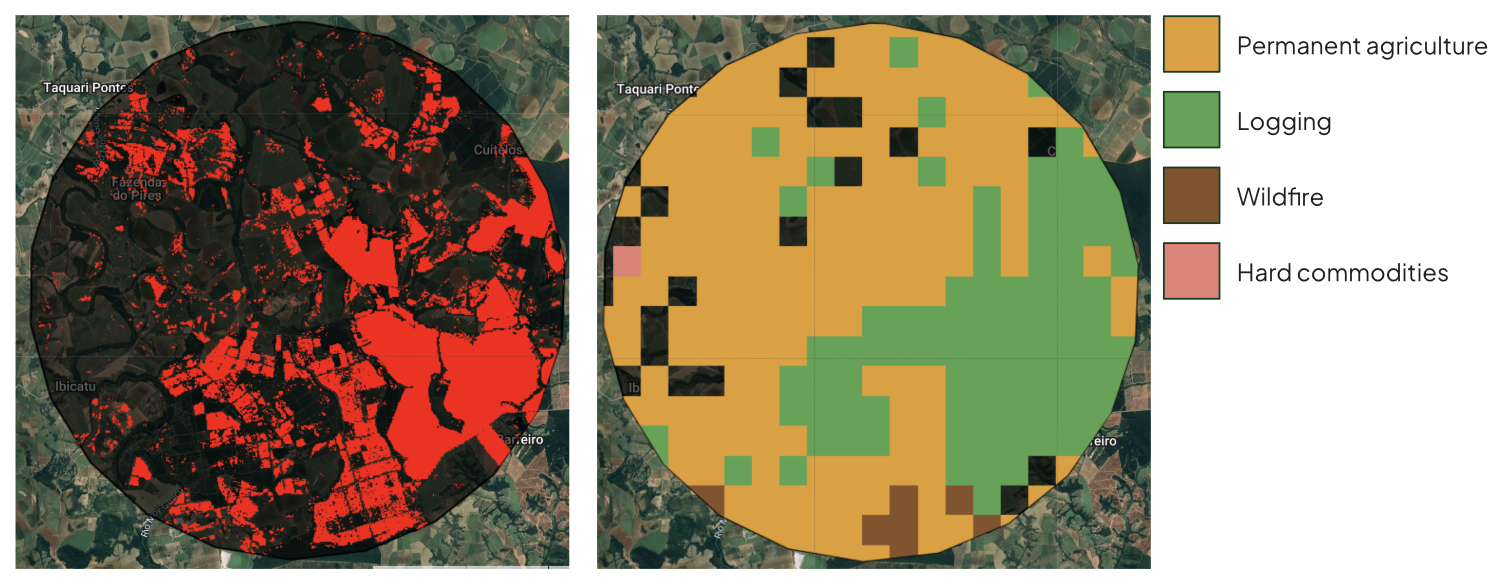
(Left) Forest Loss since 2000 in a region in the Atlantic Forest outside of São Paulo based on the Hansen Global Forest Change Dataset. (Right) Drivers of forest loss of the same region based on the WRI GDM Drivers of Forest Loss 1km dataset.
What Happens When We Monitor Everything?
Although the remote sensing revolution may enable better deforestation tracking, understanding, and mitigation, it also poses essential dangers.
-
Dual-use dilemma: The same satellite imagery and AI algorithms that enable conservationists to detect illegal logging can also be exploited by the very actors they seek to stop. Loggers, miners, and poachers could use freely available deforestation maps to identify unprotected forest patches, optimal access routes, or areas with weak enforcement presence.
-
Privacy, and autonomy concerns: Extensive environmental monitoring raises profound questions about who has the right and control to observe private lands from above. In Brazil, much of the remaining Atlantic Forest exists on private property, and landowners may reasonably ask: Should governments and NGOs be able to track every land-use decision? The same satellite surveillance used to enforce forest protection could, in different political contexts, be used to target farmers, indigenous communities, or smallholders whose survival depends on clearing small forest patches.
-
Power asymmetries: Who controls the data? Who interprets it? Advanced monitoring capabilities are concentrated in wealthy nations and well-funded institutions. At the same time, the communities most affected by deforestation often lack access to the same tools. Moreover, remote sensing may reveal what is happening but not always why. Without ground-truthing and community engagement, satellite-based enforcement risks becoming a blunt instrument that criminalizes subsistence activities while failing to address structural drivers of deforestation.
This again underlies the importance of being people-centered: technology in itself is not the panacea. It is one of many tools that can be potentially useful for effective restoration and conservation.
Conclusion
A long history of deforestation has made the Atlantic Forest the patchwork it is today, displaying centuries of interaction between societies and nature. Remote sensing has transformed our ability to monitor the Atlantic Forest at scales beyond those achievable through ground surveys alone. From simple vegetation indices like NDVI to sophisticated AI-powered embeddings, these tools can reveal patterns of loss and regeneration.
Yet technology alone cannot save forests.
Satellite data is just one piece of information to guide restoration priorities and empower local communities to protect their lands. Remote sensing is helping us see what may once have been invisible or hidden losses, but now it's up to us to act on what we see. Meanwhile, we must stay open, respectful, and cautious about the use of this technology.
Although the current Atlantic Forest is degraded, it still supports and enables an incredible array of life.
What are some examples of the sheer biodiversity of the Atlantic Forest? Why is biodiversity so important anyway? And how can we build tools to help protect what is there? That is the topic of the next part of this series.
References
A3 Part 1—Earth Engine Fundamentals and Applications—EEFA - Live Document. (n.d.). Google Docs. Retrieved November 29, 2025, from https://docs.google.com/document/u/1/d/1LrMoXDcXY7p_V0DcTJve3t37d6AfPeyJdu1Fxkzgb98/edit?usp=sharing&usp=embed_facebook
About GFW | Global Forest Watch. (n.d.). Retrieved November 29, 2025, from https://www.globalforestwatch.org/about/
AlphaEarth Foundations helps map our planet in unprecedented detail. (n.d.). Google DeepMind. Retrieved November 29, 2025, from https://deepmind.google/blog/alphaearth-foundations-helps-map-our-planet-in-unprecedented-detail/
Amaral, S., Metzger, J. P., Rosa, M., Adorno, B. V., Gonçalves, G. C., & Guedes Pinto, L. F. (2025). Alarming patterns of mature forest loss in the Brazilian Atlantic Forest. Nature Sustainability, 8(3), 256-264. https://doi.org/10.1038/s41893-025-01508-w
Dean, Warren. 1997. "With broadax and firebrand : the destruction of the Brazilian Atlantic forest". University of California Press.
Earth Science Data Systems, N. (2021, May 18). Remote Sensing | NASA Earthdata [Data Basics]. Earth Science Data Systems, NASA. https://www.earthdata.nasa.gov/learn/earth-observation-data-basics/remote-sensing
GISGeography. (2017, May 9). What is NDVI (Normalized Difference Vegetation Index)? GIS Geography. https://gisgeography.com/ndvi-normalized-difference-vegetation-index/
Introduction to the Satellite Embedding Dataset | Google Earth Engine. (n.d.). Google for Developers. Retrieved November 29, 2025, from https://developers.google.com/earth-engine/tutorials/community/satellite-embedding-01-introduction
Law No. 11,428. (n.d.). Retrieved November 29, 2025, from https://www.planalto.gov.br/ccivil_03/_ato2004-2006/2006/lei/l11428.htm
MapBiomas Brasil. (n.d.). Retrieved November 29, 2025, from https://brasil.mapbiomas.org/en/o-projeto/ October 2022, B. G. for N. (n.d.). Saving the Amazon: How science is helping Indigenous people protect their homelands. Retrieved November 29, 2025, from https://www.nature.com/immersive/d41586-022-03043-6/index.html
Marques C. M., Marcia, and Grelle, Carlos E. V. 2021. "The Atlantic Forest: History, Biodiversity, Threats and Opportunities of the Mega-diverse Forest." Springer Nature.
Sloane, M., Moss, E., Kennedy, S., Stewart, M., Warden, P., Plancher, B., & Reddi, V. J. (2025). Materiality and risk in the age of pervasive AI sensors. Nature Machine Intelligence, 7(3), 334-345. https://doi.org/10.1038/s42256-025-01017-7
WRI/Google DeepMind Global Drivers of Forest Loss 2001-2024 v1.2 | Earth Engine Data Catalog. (n.d.). Google for Developers. Retrieved November 29, 2025, from https://developers.google.com/earth-engine/datasets/catalog/projects_landandcarbon_assets_wri_gdm_drivers_forest_loss_1km_v1_2_2001_2024
Zhu, Z., & Woodcock, C. E. (2014). Continuous change detection and classification of land cover using all available Landsat data. Remote Sensing of Environment, 144, 152-171. https://doi.org/10.1016/j.rse.2014.01.011