Ecosystem Services
How do we protect nature's benefits to people?
The Tiête water basin provides water for 18 million Brazilians.
A water basin is a giant funnel where water, rainfall, and snow collect. The Tiête water basin supplies drinking water, as well as agricultural and industrial water, to approximately half of São Paulo, the most populous city in the Southern Hemisphere.
However, the basin is severely polluted, and with usage exceeding the supply, it threatens the current water supply. In fact, the National Water and Sanitation Agency (ANA) has declared it a critical basin, signifying the urgency to act.
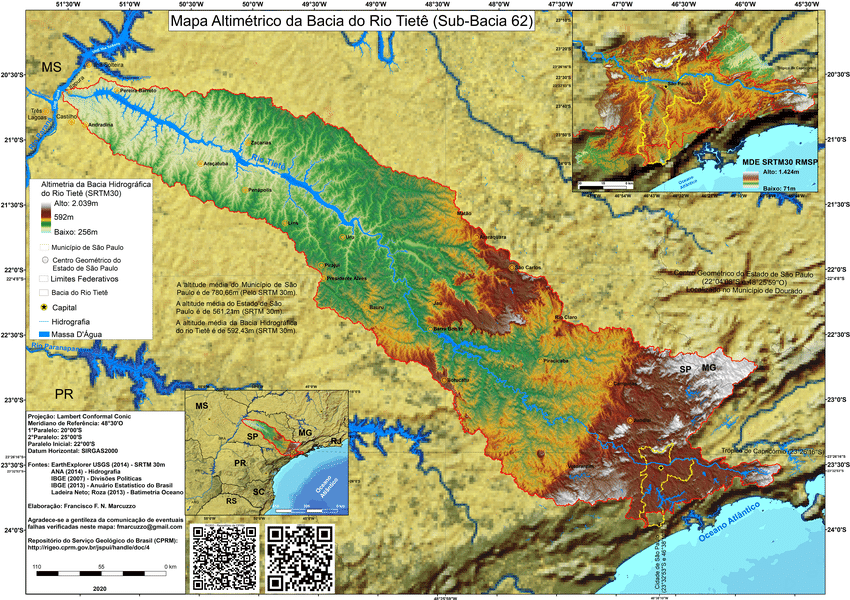
The Tiête water basin is located west of the Brazilian megacity São Paulo. Image credit: (Marcuzzo, 2020)
In summer 2025, I worked with the Stanford Natural Capital Project to help SOS Mata Atlãntica, one of the largest restoration organizations in Brazil, address its challenges. We studied how the water quality could be improved through restoration efforts.
In this article, I will use the Tiête water basin as a case study. How does the natural world provide life-critical services to people, and how can technology help us better protect them?
The Water-Forest Link
Water pollution is partly due to tree clearing.
Forest canopies and litter slow water runoff and soil erosion, decreasing the likelihood of sediment from entering streams. The complex root systems of trees also form symbiotic relationships with bacteria that break down harmful chemicals. Moreover, forests act as physical buffers, preventing excess compounds from spreading throughout the ecosystem. A Nature study from 2023 also highlights the correlation between deforestation and decreased precipitation.
A powerful real-world example of this comes from New York City’s drinking water system, where protecting forests and natural watersheds has proven more effective than building expensive filtration infrastructure. New York invested in conserving and managing the forested Catskill and Delaware watersheds to meet the demands of 8.5 million consumers in the city. These intact ecosystems naturally filter pollutants, reduce sediment runoff, stabilize soils, and maintain water quality, allowing the city to receive a federal Filtration Avoidance Determination (FED) that permits unfiltered surface water.
Therefore, forests are critical to the water supply and quality.
⚠️ In our project we focus on how reforestation can aid in building a more reslient water supply. However, it is important to note that reforestation alone cannot solve environmental pollution. It is also critical to eliminate the sources of pollution from factories, sewage treatment systems, fertilizers, pesticides, and stormwater runoff, just to name a few. Thank you to Dr. Benjamin Beck for these important points.
Riparian Buffers
Scientists have found that trees along river banks are significant.
Trees along rivers bring outsize benefits. They help stabilize river banks, preventing soil erosion and siltation. They also act as the last line of defense, preventing chemicals, runoff, and fertilizers from entering the river system. The long strips of forest along rivers also create wildlife corridors that enable animals to move over longer distances, disperse seeds, and fulfill their ecosystem functions.
The importance of these so-called riparian buffers (long stretches of trees along rivers) is why the land closest to rivers is formally protected under Brazilian law.
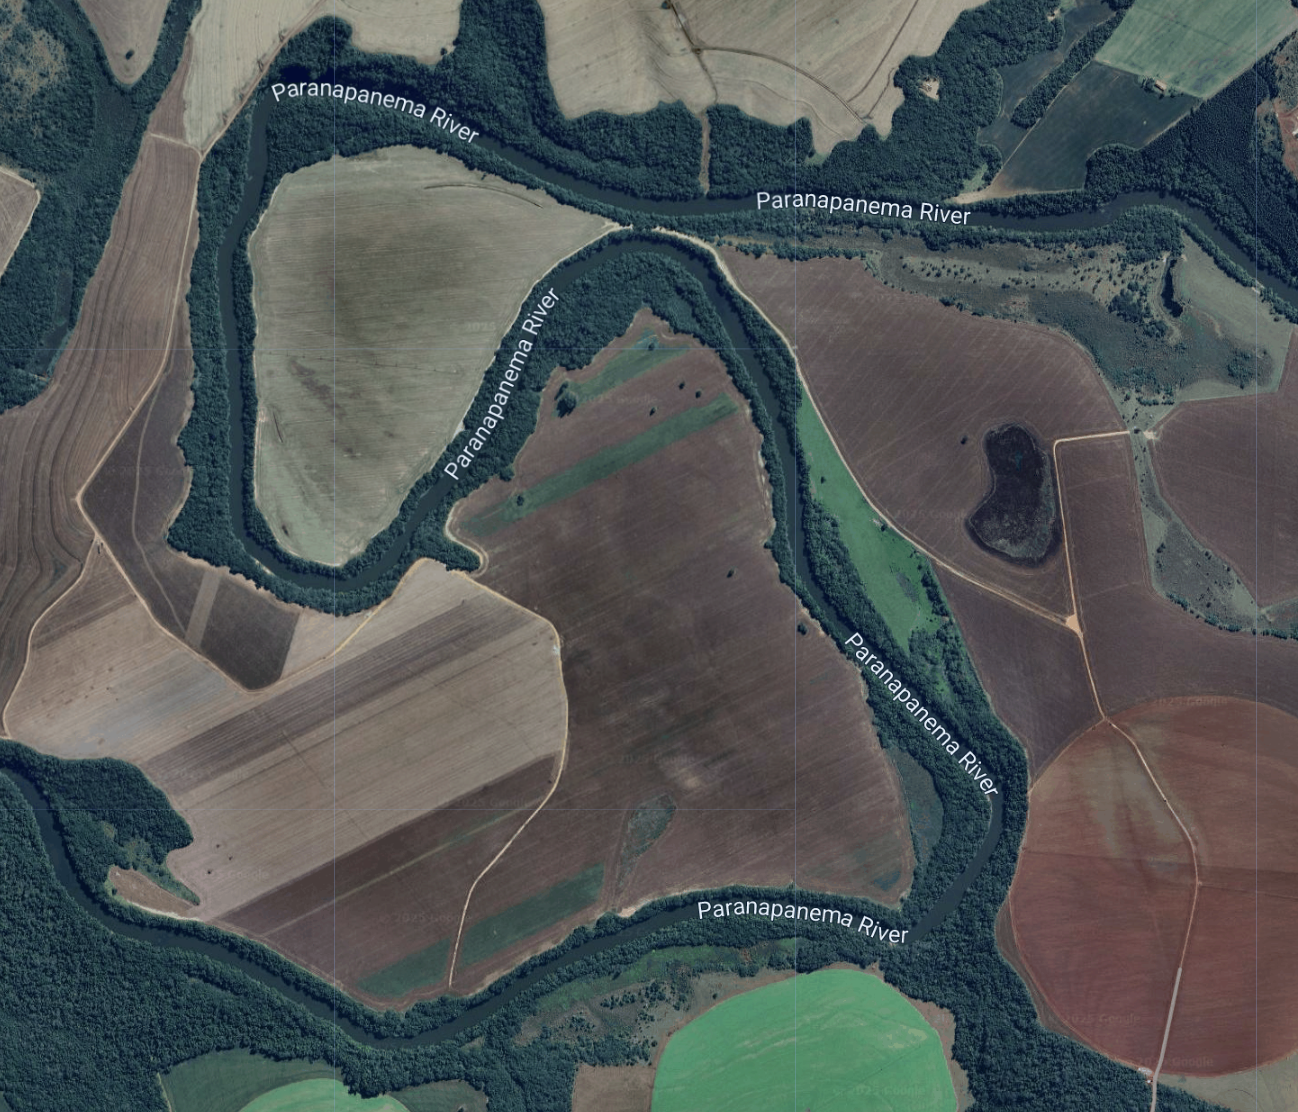
Riparian buffers from a Google Earth Engine satellite view.
If trees are so amazing, why can't we restore them everywhere?
With limited resources, it is a challenge to restore all riparian buffers. Moreover, much of the land is private, which means restoration could come into direct conflict with people's livelihoods. Also, enforcement across such a large area is tricky, as it's hard to ensure the restored areas stay restored and effective.
This is why we need to prioritize and be clever about where we plant trees.
That leads to the natural question: to determine where to start planting, how do we quantify and compare how much
Quantifying Nature's Benefit to People: Ecosystem Services
I didn't realize just how much work nature does for us.
Everything from cleaning our water and air to providing shelter to creating spaces for reflection and connection, nature's benefits to people are known as ecosystem services. Just as we talk about goods and services in terms of human and physical capital, we can use natural capital and ecosystem services for the value nature gives.
These ideas were largely spearheaded by Professor Gretchen Daily and collaborators from all over world. The Natural Capital Project was created to develop tools to quantify nature-derived benefits, enabling decision-makers to evaluate and pursue natural solutions.
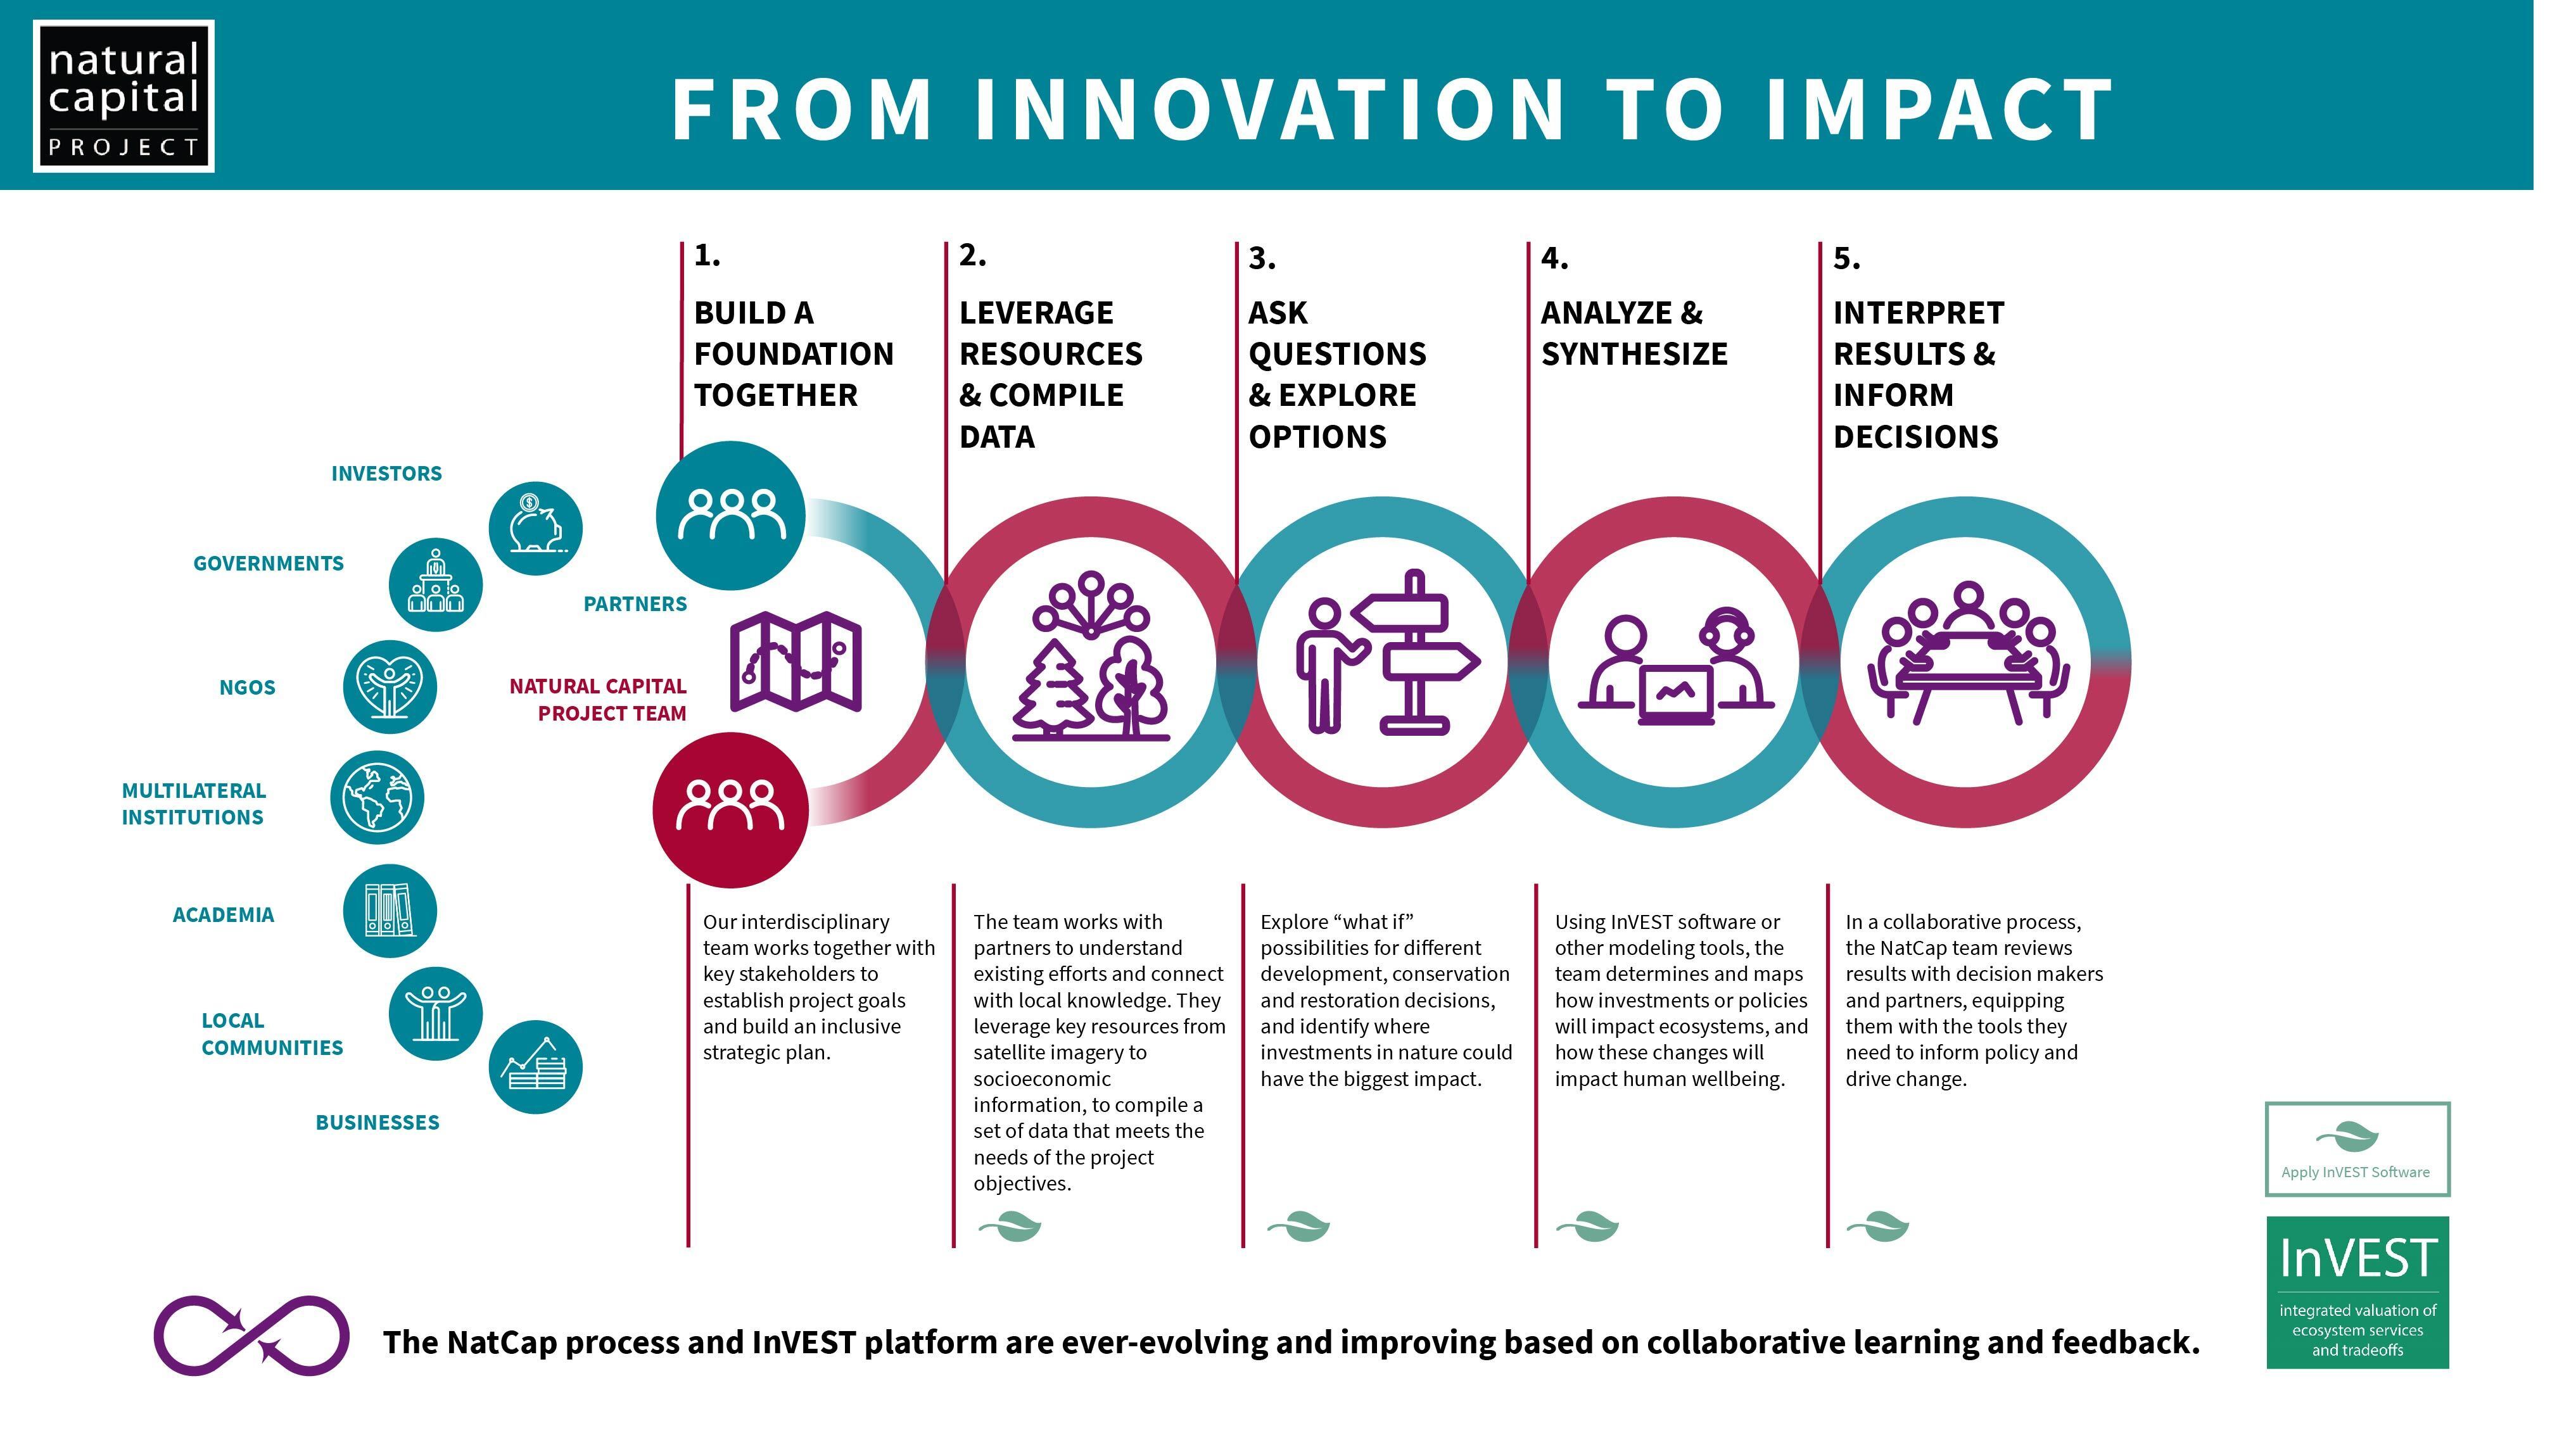
The NatCap Process. Image Credit: Natural Capital Project
This is where data- and computer science play a huge role, through simulation and quantification of an ecosystem.
Simulating an Ecosystem: InVEST
In our case with the Tiête water basin, we faced the following challenge: Where are the best places to plant trees around the Tiête basin to maximize improvements in water quality?
Therefore, we needed a way to compare the current landscape (baseline) with potential restorations and identify the areas of most significant benefit.
Conveniently, the Natural Capital Project has developed computer models for simulating ecosystem services for over 20 years.
Known as InVEST (Integrated Evaluation of Ecosystem Services), these models can simulate the flow of water, nutrients, and sediment through the landscape. This allows us to quantify everything from carbon uptake and flood risk to nutrient delivery. Therefore, we can compare various scenarios by running the models on a snapshot of the current landscape and predicted future landscapes.
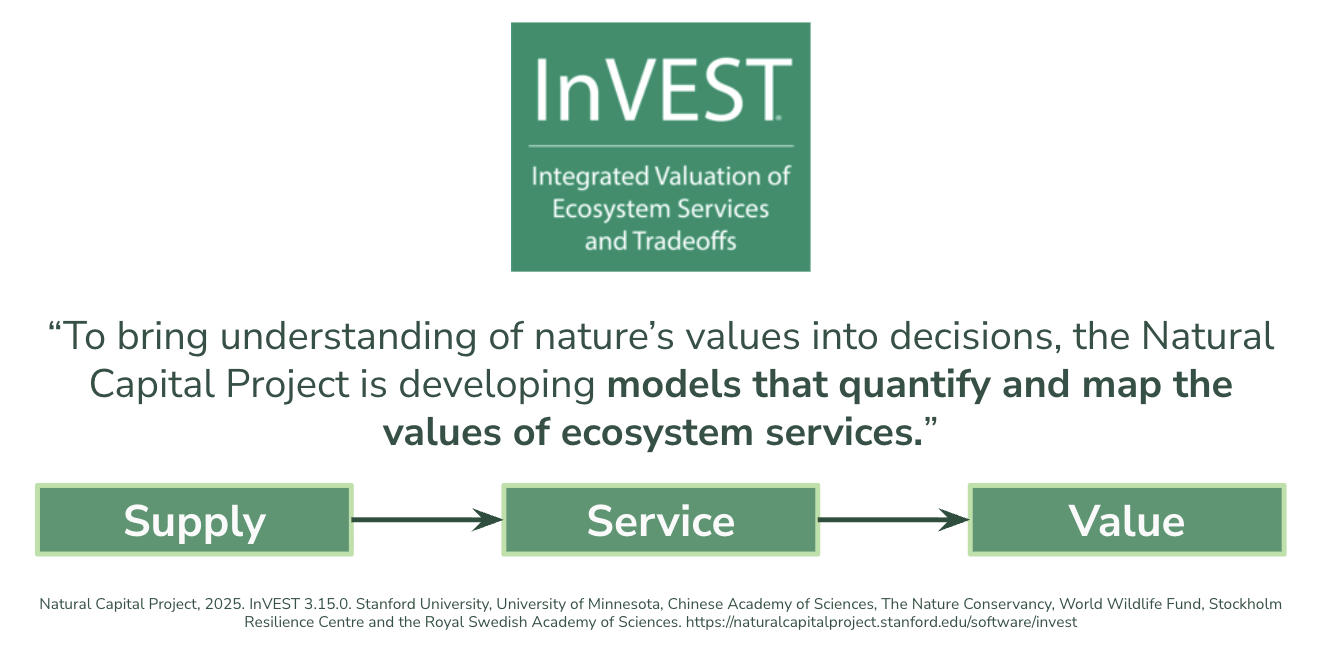
The high-level purpose of the NatCap InVEST ecosystem service models.
In essence, we prepare data (input) to run simulations (model) to predict, for instance, how many pollutants were prevented from entering the river system (output).
The data include various parameters, such as elevation, rainfall, temperature, and land cover. Then the model solves biophysical equations that, for instance, describe how water flows through the system. The models can be pretty complex, but often rely on three primary data sources: a digital elevation model (DEM), a land use and land cover (LULC) classification map, and a biophysical table.
Together, these help inform the model on how the landscape will behave.
So we did what we needed to do: collect loads of data.
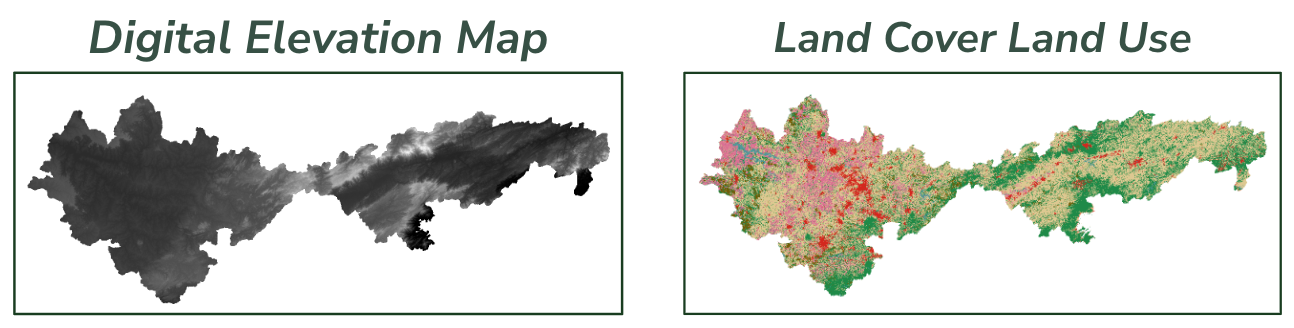
Examples for a digital elevation model (left) and a land use land cover map (right) over our study area.
The Digital Elevation Model (DEM)
The digital elevation model (DEM) is literally a digital representation of the height of each location on a planet.
These maps are typically derived from satellites that, by measuring reflected electromagnetic waves, determine distances to points on the ground. In our case, we used the Copernicus high-resolution DEM derived from the Sentinel satellite.
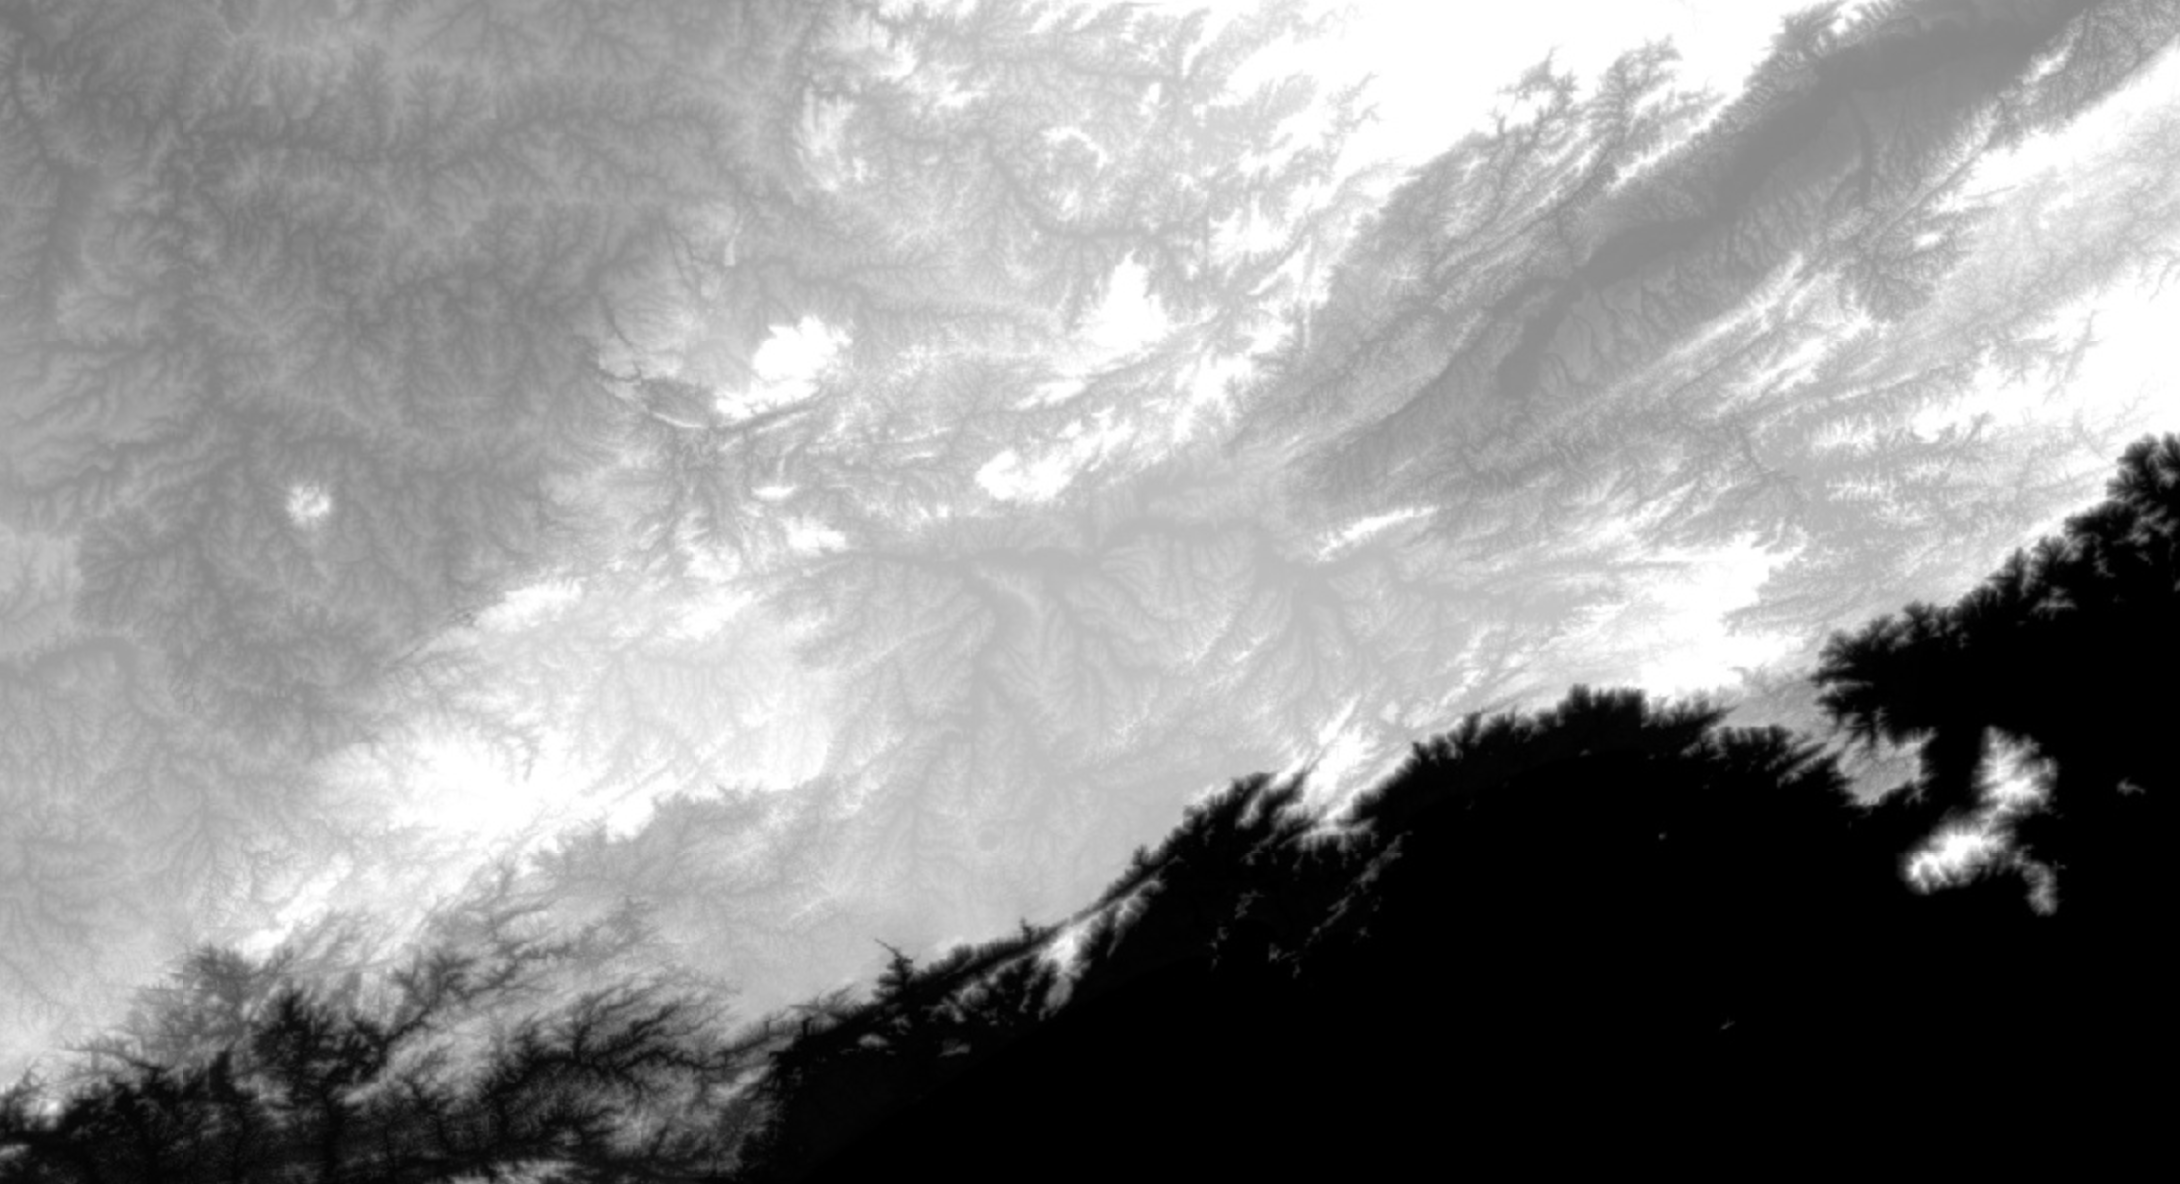
SRTM digital elevation model centered on São Paulo, Brazil.
It is surprising how accurately you can model water with just this information.
Gravity ensures water always flows towards low points, eventually reaching a river, basin, or outlet. Using just elevation data, we can get really close to recreating actual rivers. We use the modeled river systems to calibrate the model parameters until they match reality (noting that an exact match is not expected!).
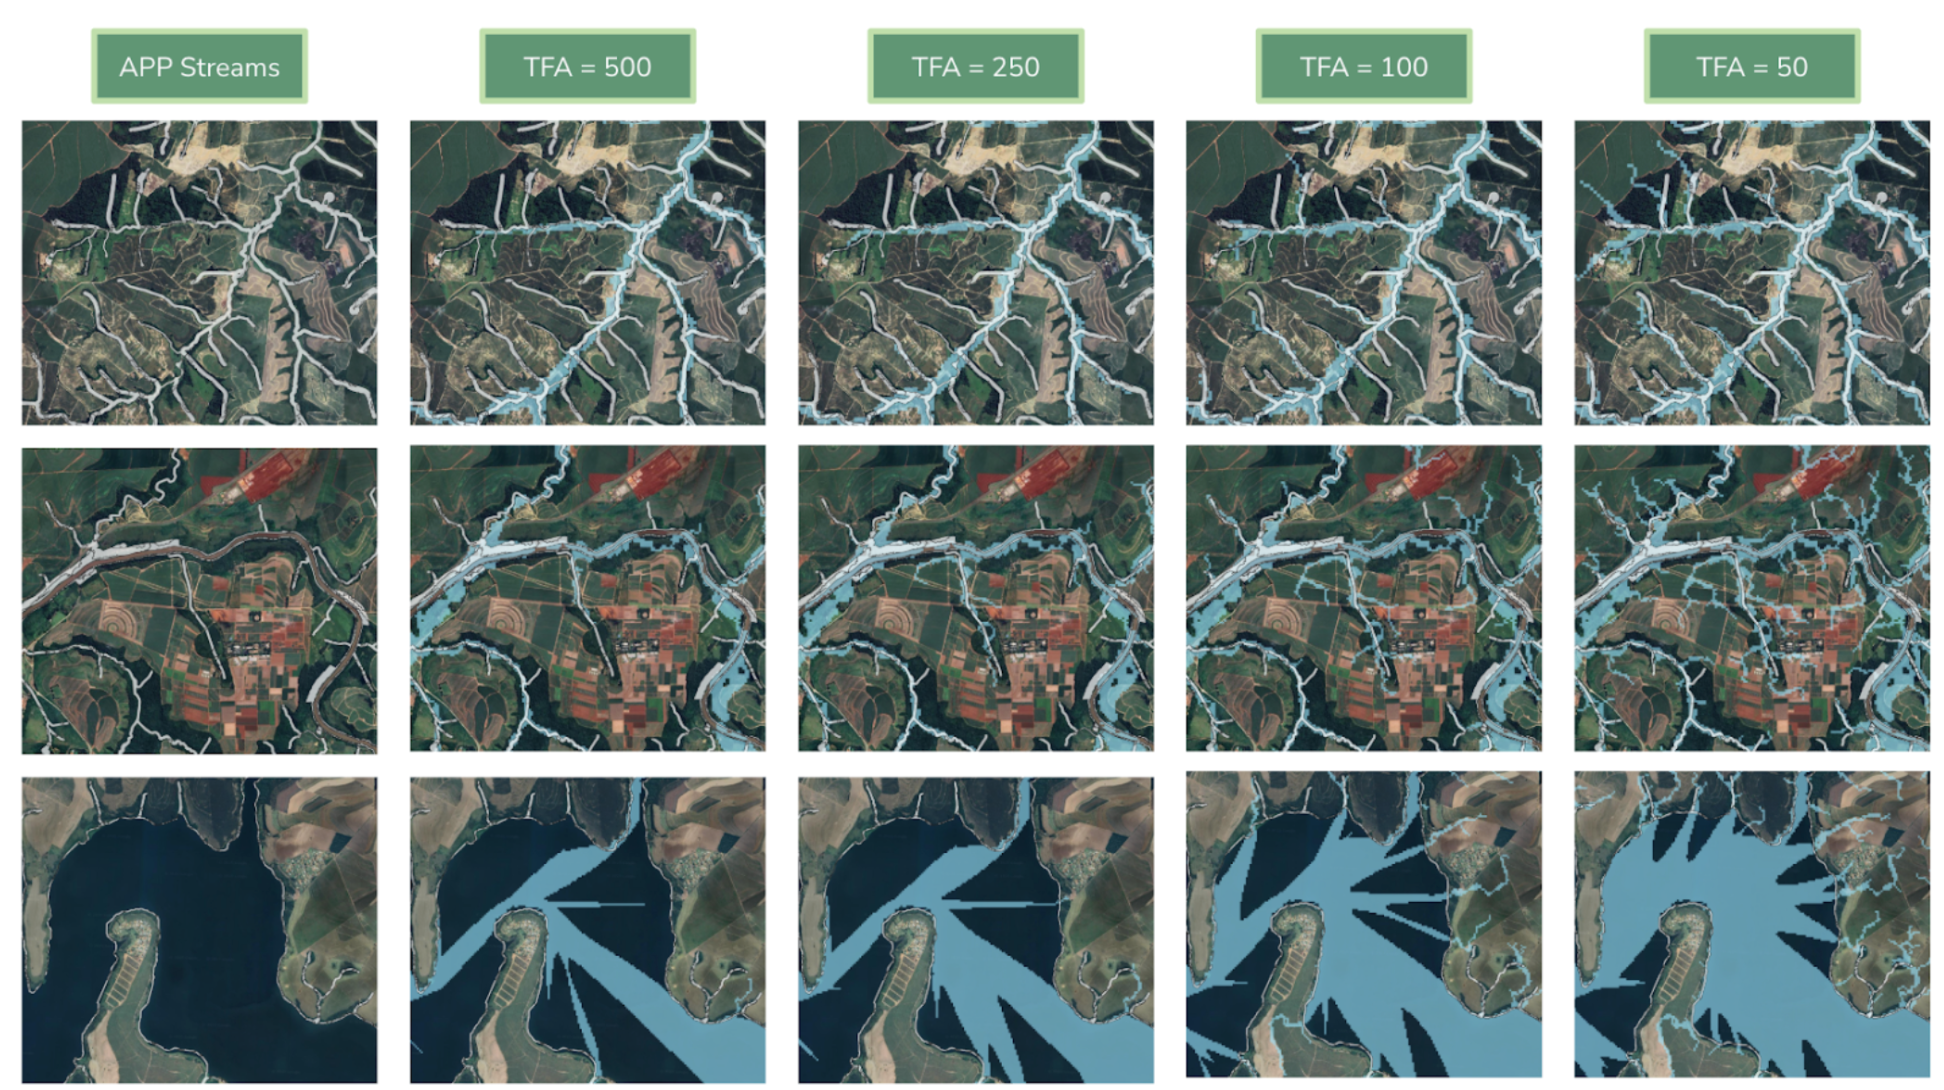
Changing model parameters to tune how accurately the models represent the riparian landscape.
The Land Use Land Cover (LULC) Classification Map
With the Digital Elevation Model, we can model where water flows through the ecosystem, but not necessarily how much.
Water interacts differently with various materials and substances. For instance, water flows over concrete, but may be absorbed by soil. Therefore, we also need to know what type of material there is at any given point and how it behaves.
Creating a map of land classification is precisely this. I like to think of it like transforming the real world into a gridded Minecraft world - quite literally!
Imagine taking an image straight down at the landscape. We then divide it into squares of fixed size, for instance, 30m by 30m, and give each square a label. A label can be 'grassland', 'forest', 'water body', 'sand dune', 'urban zone', and so on, depending on how specific you need to get.
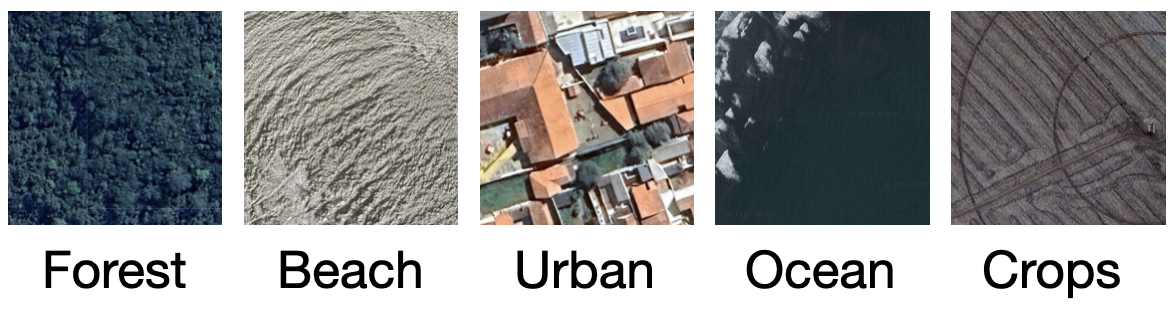
Example patches of various land use classes.
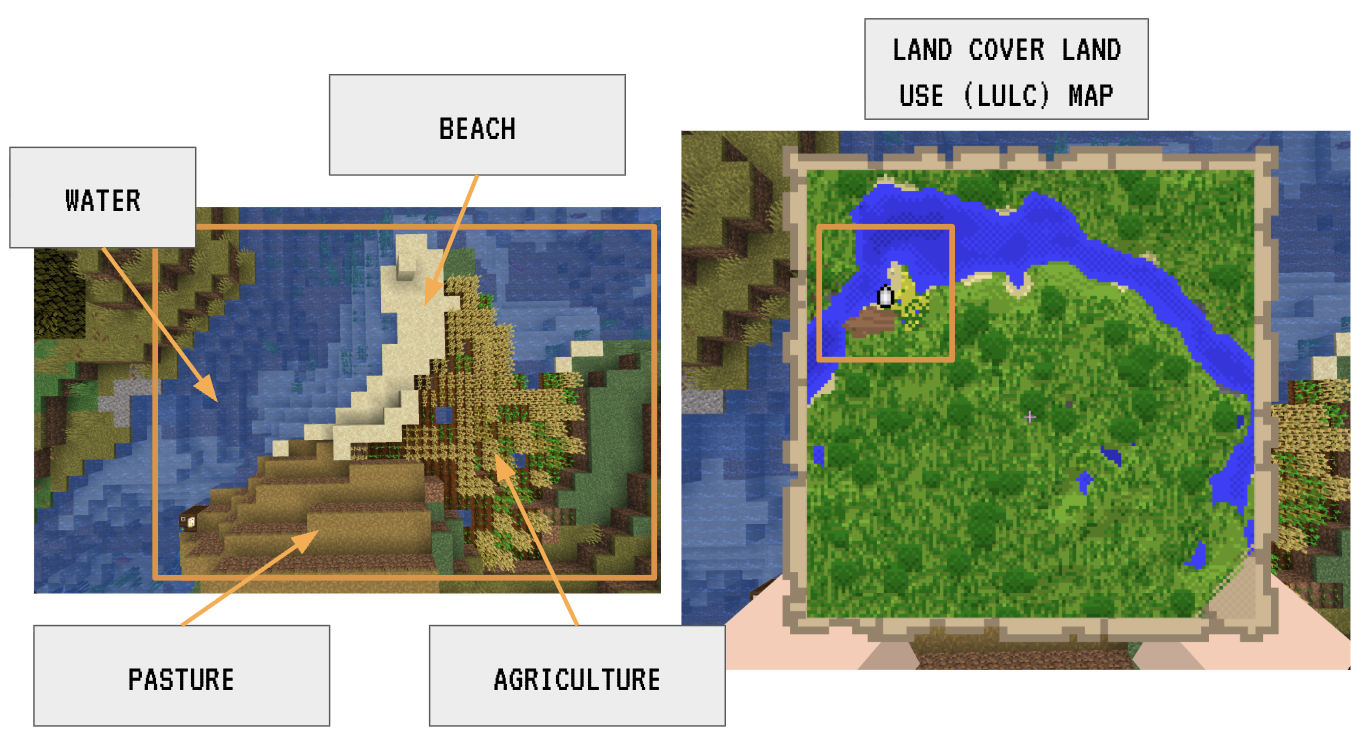
An LULC map is much like creating an abstract block version of the actual ground, where each 30mx30m cell, for instance, is classified into one of a few categories.
We relied on the MapBiomas Atlantic Forest LULC maps.
But how do you construct these maps? It would be impractical to manually label every 30x30m (or 1x1m square!). Let's say we use 30x30m resolution. Then each pixel would be 900m^2 (0.9 ha). Since Brazil is about 850,000,000 ha, we need almost 1 billion pixels to cover all of Brazil. If a person could label one pixel a second (pretty fast!), it would still take them 11,000 days (30 years) to complete. And then imagine we want an updated map every year, every month, every day, every hour, every minute!
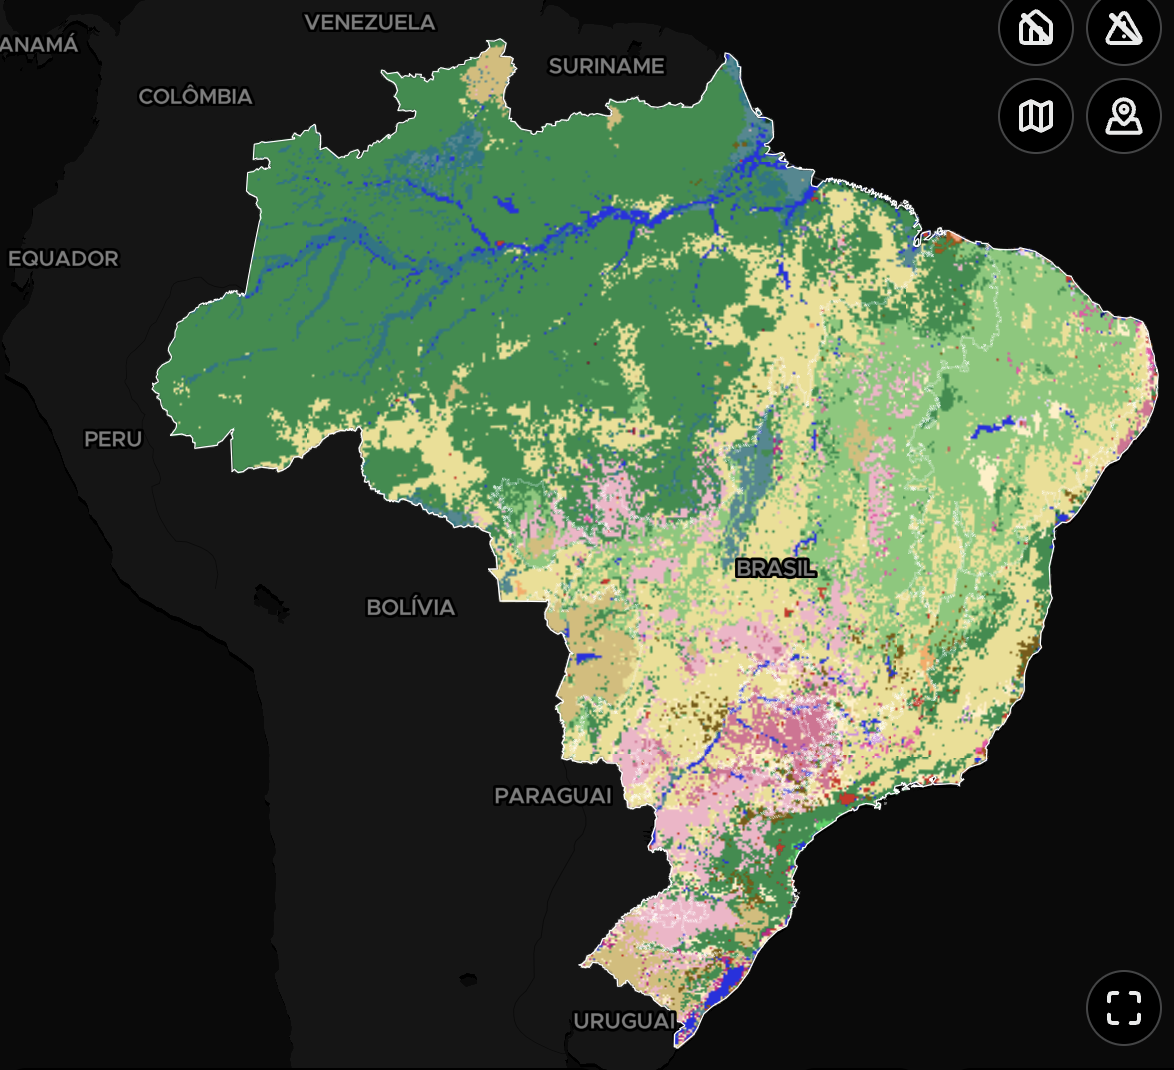
LULC Map of Brazil from MapBiomas. From MapBiomas Platform
Instead, humans can classify a subsample and then generalize using computer models.
Namely, MapBiomas uses a technique called supervised learning to train models to classify pixels. Supervised learning is a branch of machine learning. In essence, humans label a subset of pixels, which serves as a training set for the AI model.
The model is given each 30x30m pixel, tries to predict on its own, and then updates its internal logic once answered. We keep playing this game until it performs sufficiently well. Often, we hide a set of examples as a final test to see how well the model handles patches of land it has not seen during training.
MapBiomas used a type of machine learning model, specifically a convolutional neural network (CNN), designed for images. They then conducted extensive manual review and additional filtering and buffering to create high-quality annual land cover maps of Brazil since 1985.
The MapBiomas LULC map served as our baseline, i.e., the current state and use of the landscape. But then we artificially changed all pixels within riparian buffers to forest pixels to create a fictitious restored scenario. We fed both of these scenarios to the models for comparison.
The Biophysical Table
With the LULC map in hand, we know what is where. But we still need to quantify how each land cover class behaves!
A biophysical table links each land cover class with experimentally determined constants that the models use in the equations to determine things like: how much water does this land cover class take up? How much does it evapotranspate? How much water can it store? How much carbon and biomass does it store? How does this behavior change throughout the season?
Creating this table is often the trickiest part, since a forest in Brazil can behave very differently from a forest in, say, northern Sweden.
We must therefore scour the scientific literature to gather these values from studies that have experimentally examined how these land cover types behave over time in controlled settings. NatCap collects and centralizes a bank of constants from the literature that scientists can use for modelling. But this process remains highly manual. Thus, there is potential to create computational tools to help find, grow, and maintain a centralized repository of biophysical values.
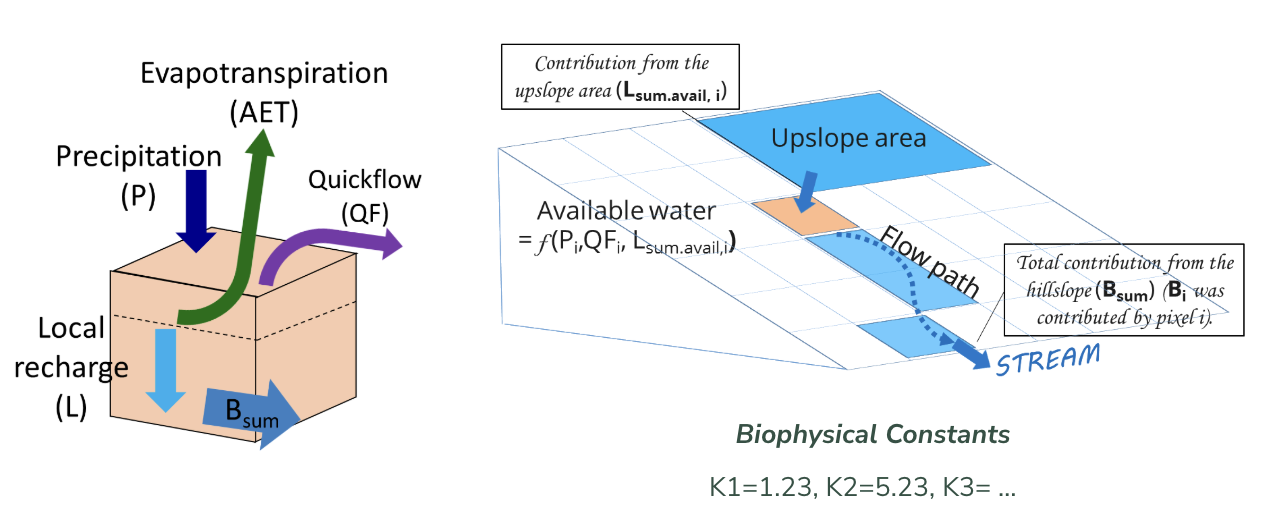
Diagrams showing the setup of how the models compute water flow throughout an ecosystem by considering the properties of each pixel in relationship with its neighbors. Image credit: InVEST User Manual.
Running the Ecosystem Models
With the data in hand, we selected three models to run:
- Carbon Model: Measures carbon stock. i.e., how much carbon can be stored in the biomass
- Nutrient Delivery Model: How much P and N. Think nutrients are plain good, but too much can actually lead to bacteria growing out of control and clogging up the river.
- Sediment Delivery Model: Sediment and siltation, i.e., when sediment enters the river stream, have detrimental effects on river water quality. The sediment delivery model quantifies how much sediment any given pixel delivers to the river.
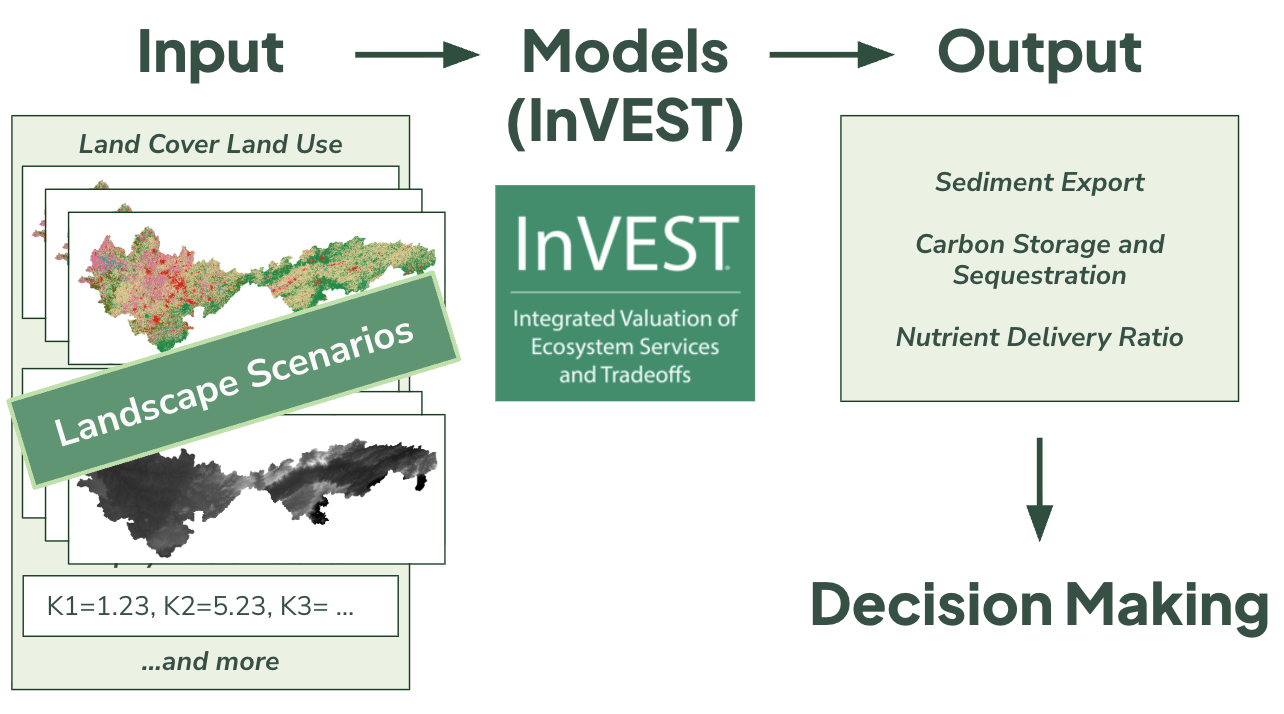
Example flow of our use of the InVEST models.
We used the calibrated model parameters from the river prediction runs to run the models on both the baseline and restored scenarios. Notably, in our case, we couldn't use the absolute values; instead, we used the relative values to identify the areas in the restored scenario that provided the most significant improvement relative to the baseline.
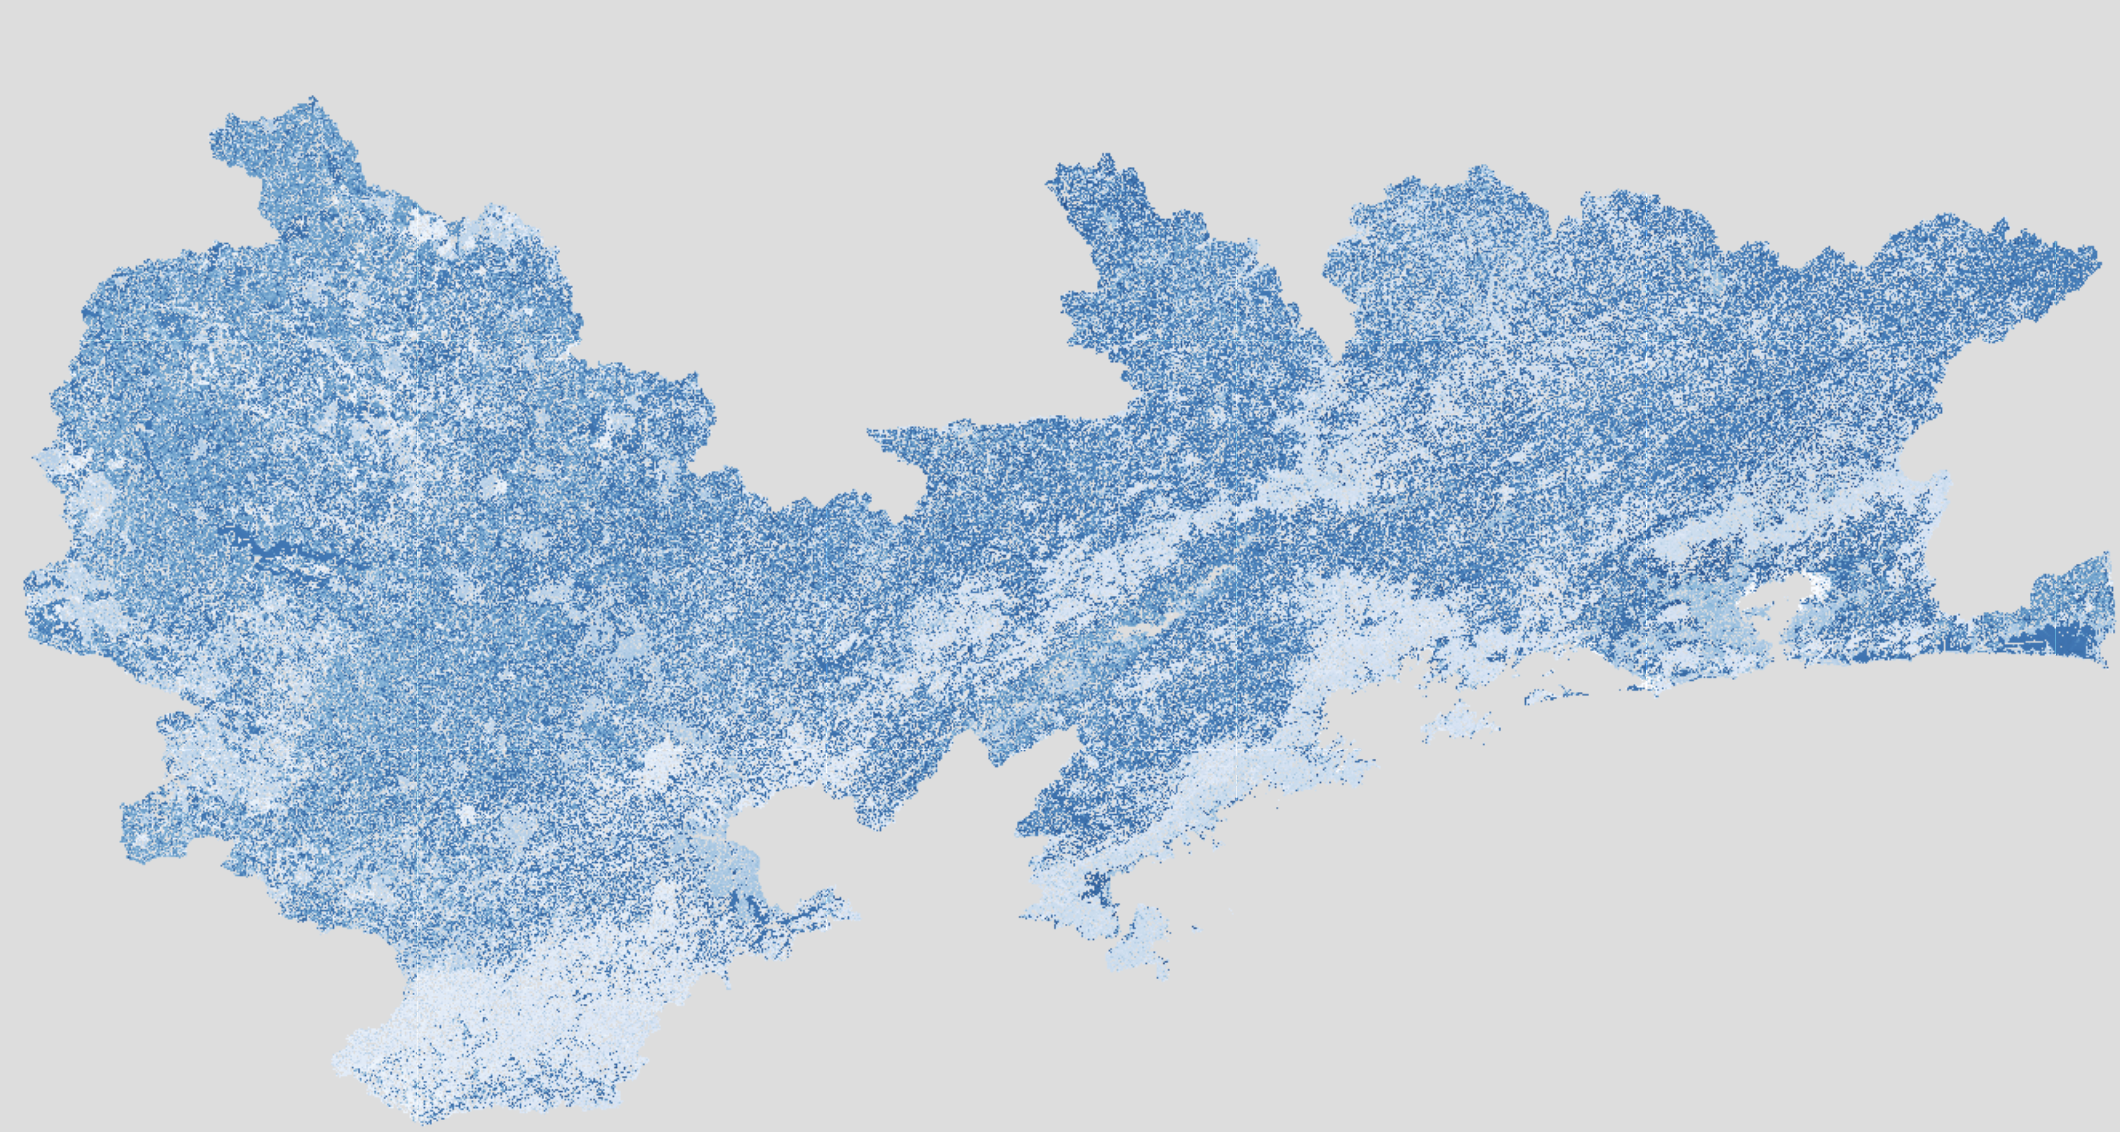
Result layer from the Nutrient Delivery Model showing phosphorus export into streams across our study area.
We also ran the models multiple times with different parameter settings to perform a sensitivity analysis. This allowed us to see how sensitive the model outputs were to small changes in, for example, a biophysical constant.
Using the model outputs, we could create bar charts for carbon, nitrogen, phosphorus, and sediment delivery. As expected, we saw higher carbon storage capacities, lower nitrogen and phosphorus leakage, and lower sediment yield in the restored scenarios.
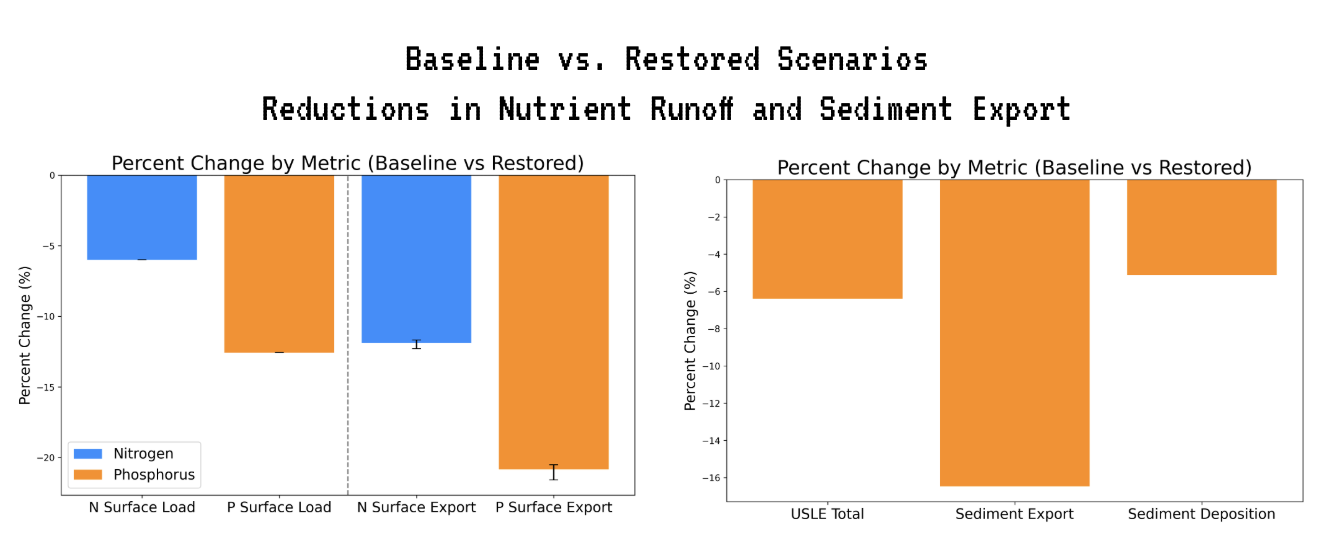
Barcharts comparing the model output values between baseline and restored scenarios.
We could then overlay the results on a map and normalize by municipality area to get heatmaps of restoration effectiveness.
At this stage, you could turn the problem into a multiobjective optimization problem. One tricky thing is that a forest in one spot may be best for sediment retention but not for carbon uptake, and vice versa. In a multiobjective prioritization, you try to find the optimal combination that maximizes the benefits computationally.
In our scenario, we valued all ecosystem service benefits equally, so we overlaid the service heatmaps and renormalized.
We see that darker areas correspond to regions with disproportionately more ecosystem services. These regions are therefore areas worth prioritizing for forest restoration around the watershed.
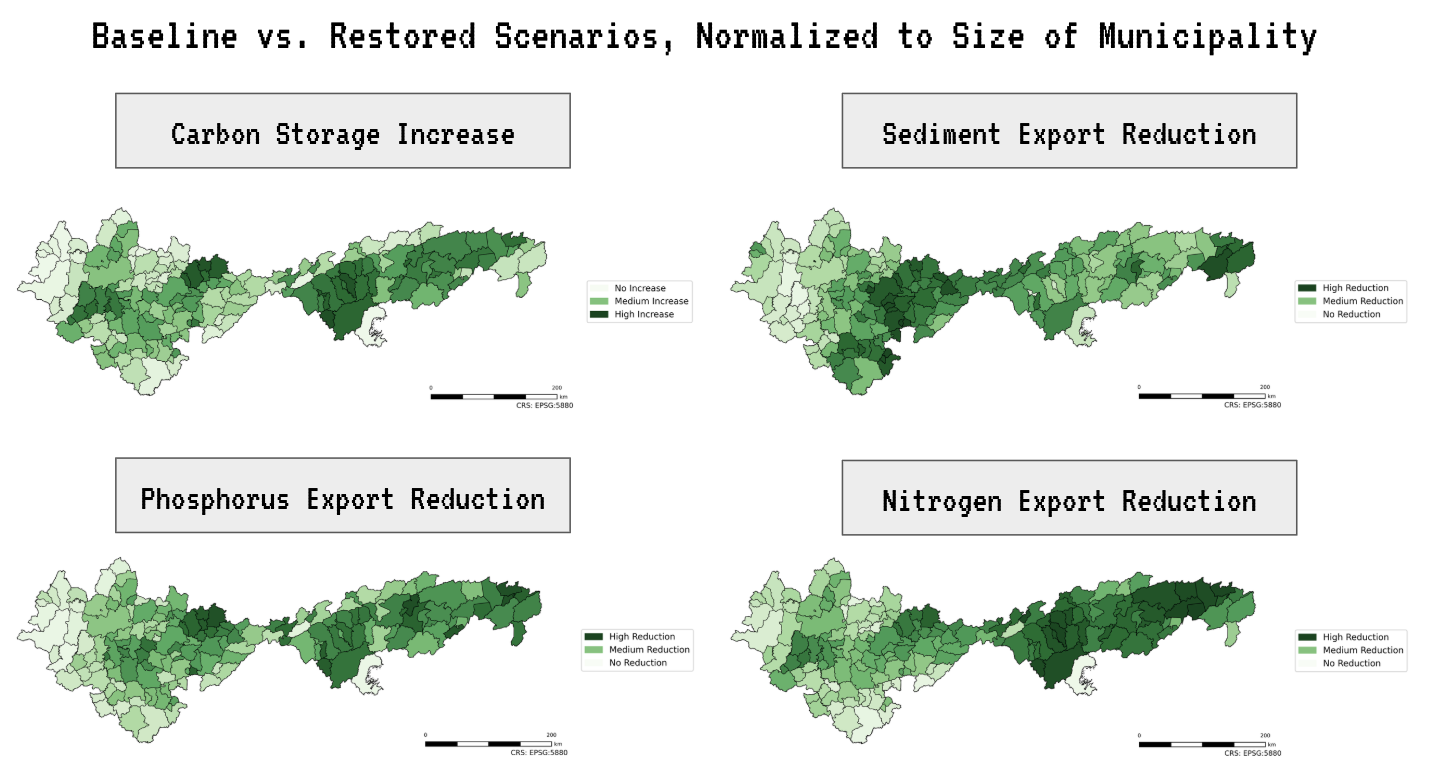
Heatmaps of restoration potential across our study area.
Can and Should We Always Quantify Nature?
In short, the Natural Capital Project models helped us analyze which potential forest regions would provide disproportionate benefits to people.
Quantifying ecosystem services helps us take nature into account and evaluate it along with other options. However, it is not always clear how the evaluation should be conducted, or even whether it can be done at all. Because how could we ever put a monetary value on nature?
The models we used in this study are only a subset of those available. Today, there is a whole ecosystem of computational ecology tools and models, each pushing new methods and techniques.
Because in the end, it is all about finding ways for humans to better co-exist with nature. Building a world in which human and planetary health form a system that thrives together.
References
Brumberg, H., Beirne, C., Broadbent, E. N., Maria, A., Lucia, S., Alberto, C., … Whitworth, A. (2021). Riparian buffer length is more influential than width on river water quality: A case study in southern Costa Rica. Journal of Environmental Management, 286, 112132–112132. https://doi.org/10.1016/j.jenvman.2021.112132
Costanza, R., Groot, R. de, Braat, L., Kubiszewski, I., Fioramonti, L., Sutton, P., … Grasso, M. (2017). Twenty years of ecosystem services: How far have we come and how far do we still need to go? Ecosystem Services, 28, 1–16. https://doi.org/10.1016/j.ecoser.2017.09.008
da Cunha, E. R., Bacani, V. M., & Panachuki, E. (2017). Modeling soil erosion using RUSLE and GIS in a watershed occupied by rural settlement in the Brazilian Cerrado. Natural Hazards, 85(2), 851–868. https://doi.org/10.1007/s11069-016-2607-3
Guerra, A., Resende, F., Bergier, I., Fairbrass, A., Bernardino, C., Centurião, D. A. S., Bolzan, F., Marcel, G., Rosa, I. M. D., da Silva, J. C. S., Garcia, L. C., Larcher, L., de Oliveira, P. T. S., Chiaravalloti, R. M., Roscoe, R., Louzada, R., Santos, S., Tomas, W. M., Nunes, A. V., & de Oliveira Roque, F. (n.d.). Land use and regulating ecosystem services scenarios for the Brazilian Pantanal and its surroundings under different storylines of future regional development. Conservation Science and Practice, n/a(n/a), e70012. https://doi.org/10.1111/csp2.70012
Guidotti, V., Silvio, Fernando, L., Gerd Sparovek, Taniwaki, R. H., Garcia, L. G., & Brancalion, P. H. S. (2020). Changes in Brazil’s Forest Code can erode the potential of riparian buffers to supply watershed services. Land Use Policy, 94, 104511–104511. https://doi.org/10.1016/j.landusepol.2020.104511
Hamel, P., & Bryant, B. P. (2017). Uncertainty assessment in ecosystem services analyses: Seven challenges and practical responses. Ecosystem Services, 24, 1–15. https://doi.org/10.1016/j.ecoser.2016.12.008
Home | SOS Mata Atlântica. (n.d.). Retrieved December 12, 2025, from https://www.sosma.org.br/
InVEST 3.17.2: Integrated Valuation of Ecosystem Services and Tradeoffs (Version 3.17.2). (2025). [Computer software]. GitHub. https://doi.org/10.60793/NATCAP-INVEST-3.17.2
InVEST. (2026). Retrieved January 8, 2026, from Natural Capital Alliance website: https://naturalcapitalalliance.stanford.edu/software/invest
MapBiomas Brasil. (n.d.). Retrieved December 12, 2025, from https://brasil.mapbiomas.org/
Mapbiomas Collections. (n.d.). Retrieved August 14, 2025, from https://brasil.mapbiomas.org/en/colecoes-mapbiomas/
Marcuzzo, F. (2020). BACIA HIDROGRÁFICA DO RIO TIETÊ: PRECIPITAÇÃO PLUVIOMÉTRICA ESPACIALIZADA - TIETÊ RIVER WATER BASIN: SPACIALIZED RAINFALL - TIETÊ RIVER HYDROGRAPHIC BECKEN: SPATIALISIERTE PLUVIOMETRISCHE AUSFÄLLE - BACINO IDROGRAFICO DEL FIUME TIETÊ: PRECIPITAZIONE PLUVIOMETRICA SPATIALIZZATA - http://rigeo.sgb.gov.br/jspui/handle/doc/21752. Geographia Meridionalis, 5, 243. https://doi.org/10.15210/GM.V5I3.16926
Natural Capital Project. (2025, December 2). https://naturalcapitalproject.stanford.edu/
Newly Updated Filtration Waiver Confirms Success of Ongoing Efforts. (2022, December). The Official Website of the City of New York. https://www.nyc.gov/site/dep/news/22-040/newly-updated-filtration-waiver-confirms-success-ongoing-efforts-provide-highest-quality-nyc?utm_source=chatgpt.com
Padilha, J., Carvalho-Santos, C., Cássio, F., & Pascoal, C. (2024). Land Cover Implications on Ecosystem Service Delivery: A Multi-Scenario Study of Trade-offs and Synergies in River Basins. Environmental Management, 73(4), 753–768. https://doi.org/10.1007/s00267-023-01916-8
Smith, C., Baker, A., & Spracklen, D. V. (2023). Tropical deforestation causes large reductions in observed precipitation. Nature, 615(7951), 270–275. https://doi.org/10.1038/s41586-022-05690-1
Supriyanto, S., Nowo Martono, D., Sari Hasibuan, H., & Mulyo Hartono, D. (2024). Assessing payment for ecosystem services to improve lake water quality using the InVEST model. Environmental Economics, 15(1), 149–173. https://doi.org/10.21511/ee.15(1).2024.12